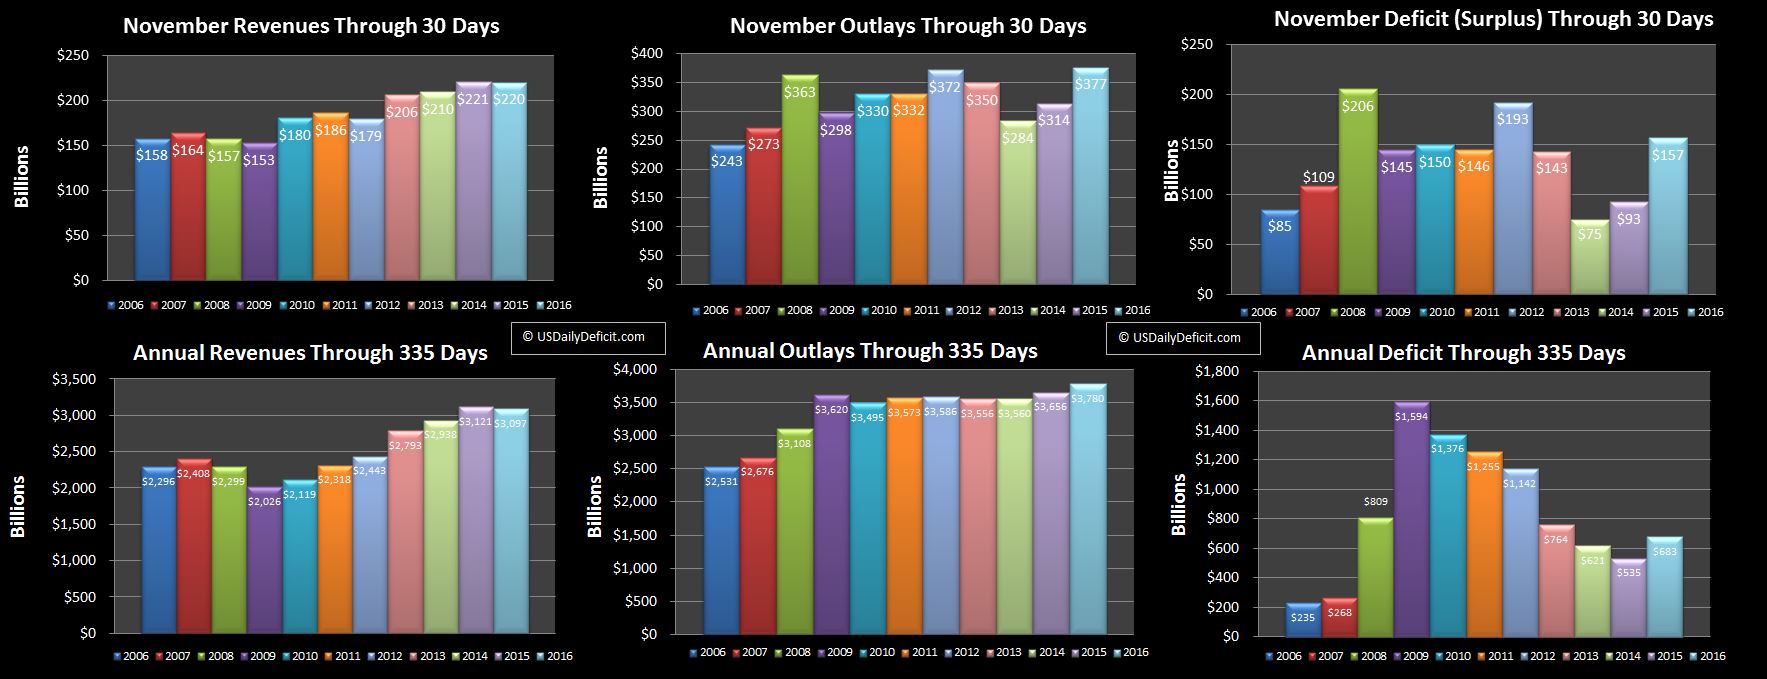
Wow!! Bad month… bad year… Working on full write up, but bottom line is revenues down year over year and deficit up for the first time since 2009.
Just a chart for now…
**Chart title corrected from October to November…charts were correct
Not looking good…
Hey guys…just wanted to give everyone a heads up that I’ve been writing for Seeking Alpha…if you are interested check out the links below. So far, mostly about oil and stocks, but hoping to slip some deficit articles in at some point as well.
Data Download: Petroleum Inventories Decline 7 Million Barrels
Kinder Morgan’s $1 Billion A Year Honey Pot Runs Dry In 2021
If you enjoy it…sign up to be a follower and you will get updates every time an article is published.
Enjoy!!
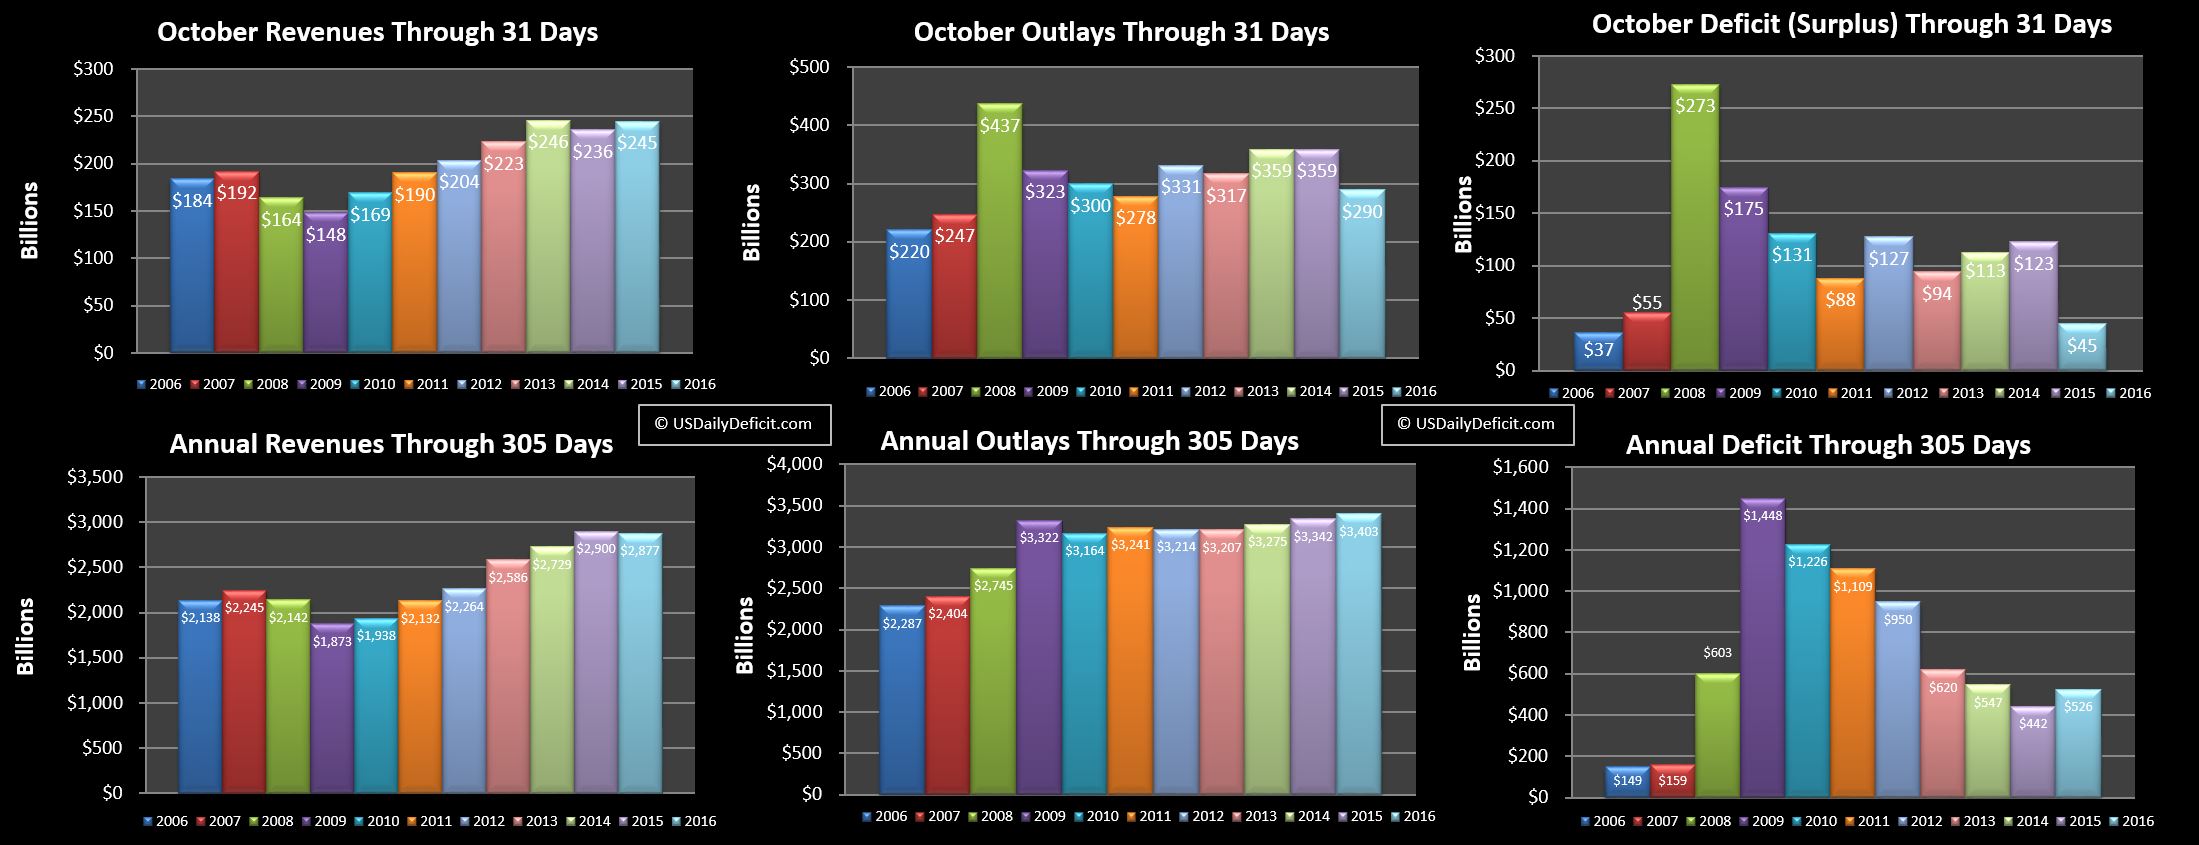
The US Cash Deficit for October 2016 came in at $45B for the month, bringing the year through 10 months to $526B.
Revenues:
Revenues were up 4% climbing $9B to $245B compared to last October’s $236B. That’s fairly impressive especially on the back of withheld taxes being up 8%, all on one less business day than last October. For the year, revenues are still down $23B, certainly within striking distance to top last year, but still almost certain to be a poor showing for the year even if we do manage to top last year, which is far from certain.
Outlays:
At first glance, outlays were down huge from $359B to $290B. It turns out that we have two timing events doubled up that account for the dip. First up, ~$45B of cost due this October 1, actually went out at the end of September due to the weekend timing, leaving this October’s number artificially low. Second, last October was artificially high due to the same reason, payments due November 1 were paid at the end of October, boosting last Octobers spend. At the end of the day, these timing issues net out, so a few days into November we are right back where we started, running about 3% over last year.
Deficit:
At $526B, we are running nearly $100B over last year and headed to end the year over $600B, ending 6 straight years of deficit improvement dating back to 2010.
Summary:
It is encouraging to see withheld taxes at +3.9% for the year, indicating that the employment gains we are seeing are translating into increased tax revenue. Offsetting that is taxes not withheld(-6%), corporate taxes(-12%), along with increased tax refunds, which I count as negative revenue. One can hope that next year payroll taxes continue to increase at this solid rate, and the other tax categories stabilize or even improve, leaving us in the +3% ballpark. In the meantime, it’s bad and getting worse, but not particularly quickly. As far as I can tell, neither Clinton or Trump has a legitimate plan to fix this problem, leading me to believe we could be back in the $1T per year ballpark much quicker than the current trend line indicates. Stay tuned… between the election, year end, tax season, and a March 2017 debt limit, tis the most interesting time of the year!!
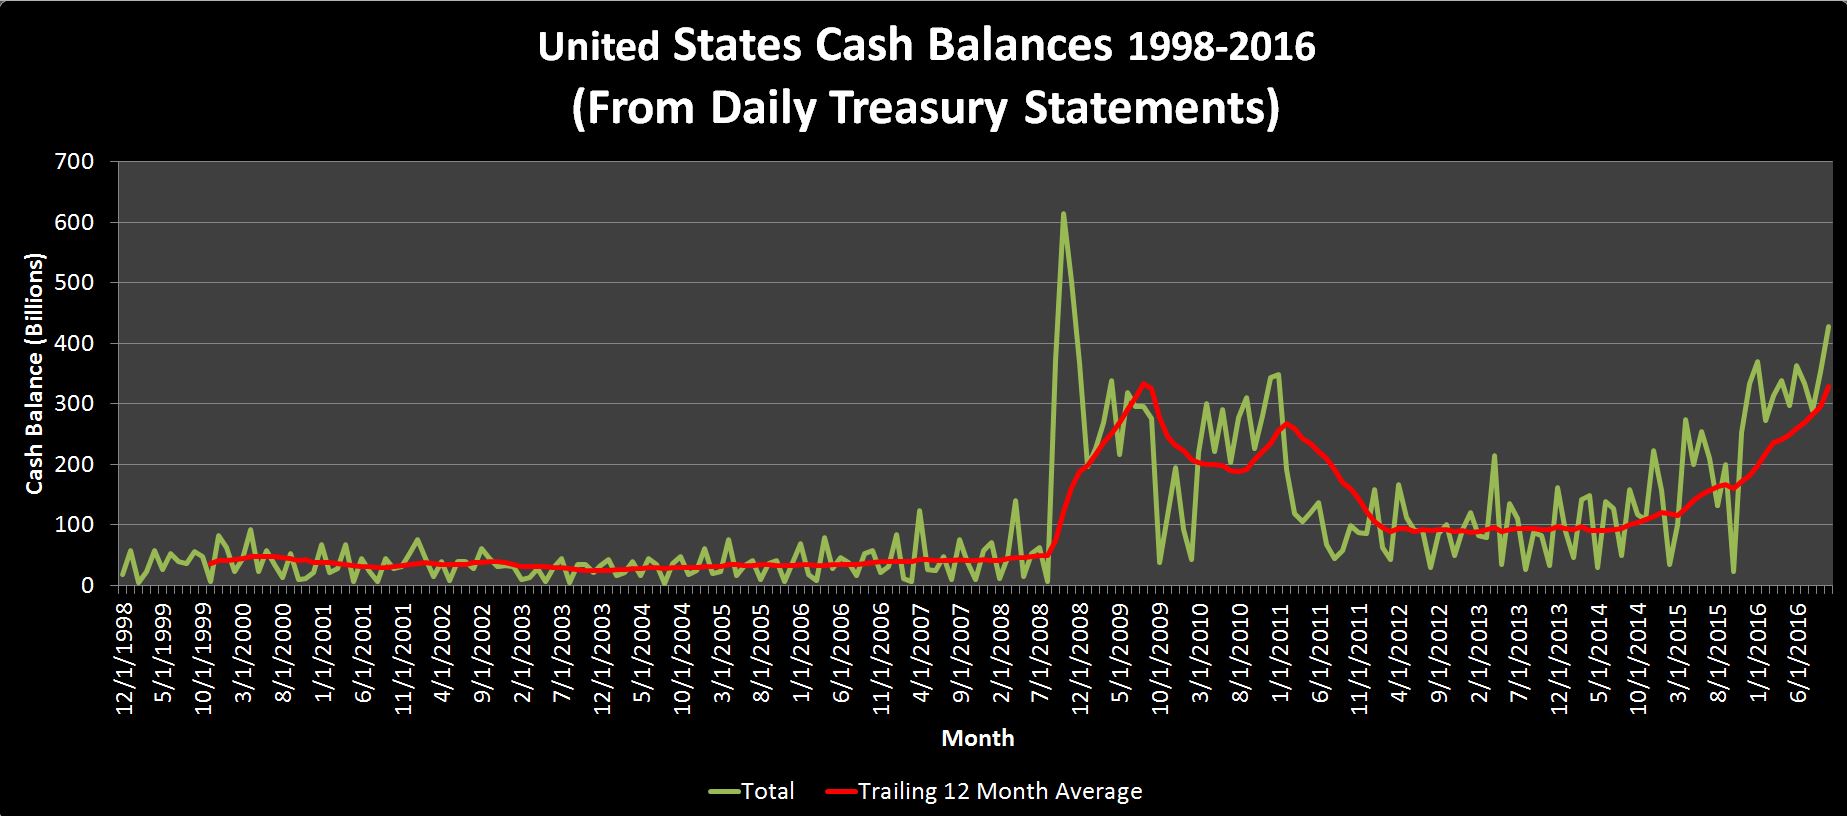
I’ve been watching this develop for a while for a while…Here’s the deal…As of last Friday, Treasury had built up a cash balance of $428B. Now, that might not sound like a lot……Hah!!…just kidding… It’s huge and enormous and completely unnecessary. To put it in perspective, Treasury could stop borrowing today, and not borrow another penny for the next 8-10 months.
Here is the historical chart:
 For the 10 years heading up to the “Great Recession” Treasury maintained an average balance of about $36B. They used this balance, and daily cash inflows to pay for daily expenditures and issued new debt as necessary to fund the deficit. Then, in the second half of 2008, borrowing soared, ending 10/2008 with over $600B cash in the bank as they prepared to…well, we all know what they did with the cash…no need to bring that up again here 🙂 Balances were kept high for a few years before leveling off at about 100B, but have been headed back up lately.
So…who cares you may wonder? Well, think of it as a this way. Our good stewards at treasury could take say $400B of “excess” cash, and pay down the debt by that much, assuming an average rate of 2%, and save a cool $8B a year…just by not having a really stupid cash management policy. I know…I know…chump change right?
Debt Limit Avoidance?
This is the most likely answer. After the last debt limit battle ended last November, the debt limit was suspended until 3/15/2017…meaning that they could issue as much debt as they wanted in the meantime. Now I haven’t waded through the specifics of the law, but my thought all along has been…ok…If I were in charge, and I didn’t want to deal with that nonsense again, on 3/14/2017, I would just issue maybe $3-$4T of debt, park the cash in my Federal Reserve bank account, and use that to squeak by the next 4 years. Clearly they don’t think they can pull that off without consequences, but they do seem intent to make sure the next president (I am guessing they are pulling for Clinton) hits the ground running. Back of the envelope, if we hit the debt limit 3/15/2017 with $400B of cash in the bank, the government will likely be able to go a full year without raising the debt limit just by burning down the cash balance and re-deploying “Extraordinary Measures”
I’ll just leave it at that for now….I’ll leave the conspiracy theories to the experts!!


