All Posts By

copernicus

July 2017 Cash Deficit: $33B

By | Daily Deficit

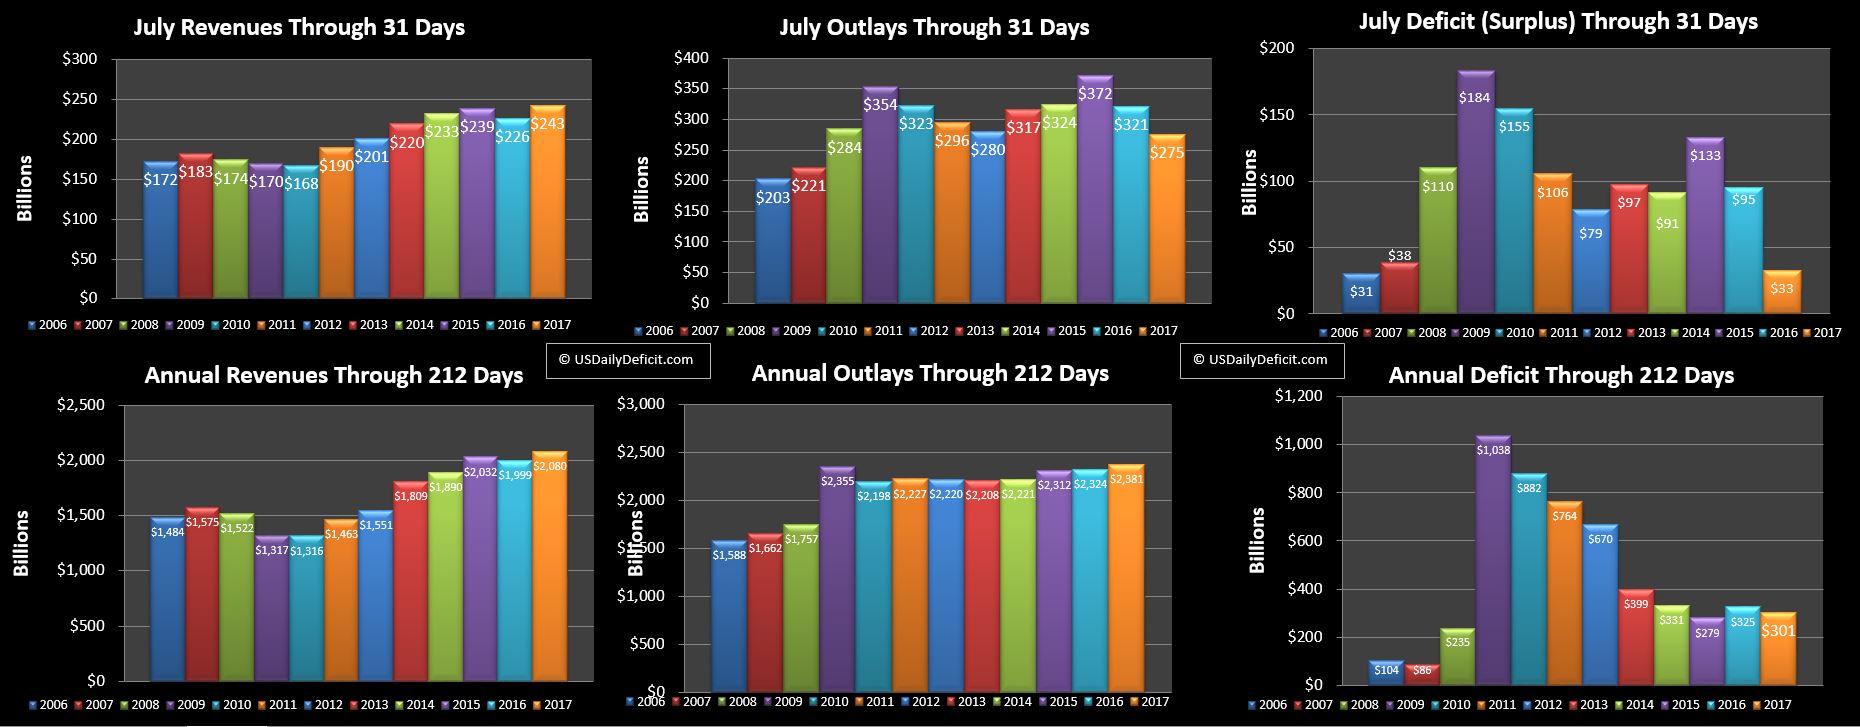
Not a bad looking month….Some of the revenue beat was timing, but the YTD is now at +4%. All of the outlay beat was timing, and the YTD oulays are up 2.5%. So far, through 7 months the revenue increase is just edging out the increase in expenses and as a result the deficit is down $24B….

Down is good, but it’s not a spectacular number….and since Treasury is now hiding hundreds of billions of debt via extraordinary measures(EM) to circumvent the debt limit…there’s a good chance some of this is illusory, but we won’t know for sure until the debt limit is increased, probably in the September-October time frame. Don’t get me wrong, it shouldn’t be a huge revision, but it could make +$24B disappear in the blink of an eye….or not, who knows 🙂

Looking forward…August will not be kind to Treasuries cash balance, currently at $189B, look for a ~$125B+ deficit, and a cash draw in that ballpark depending on how much EM they have left in the secret book of tricks.
June 2017 Cash Deficit: $23B

By | Daily Deficit

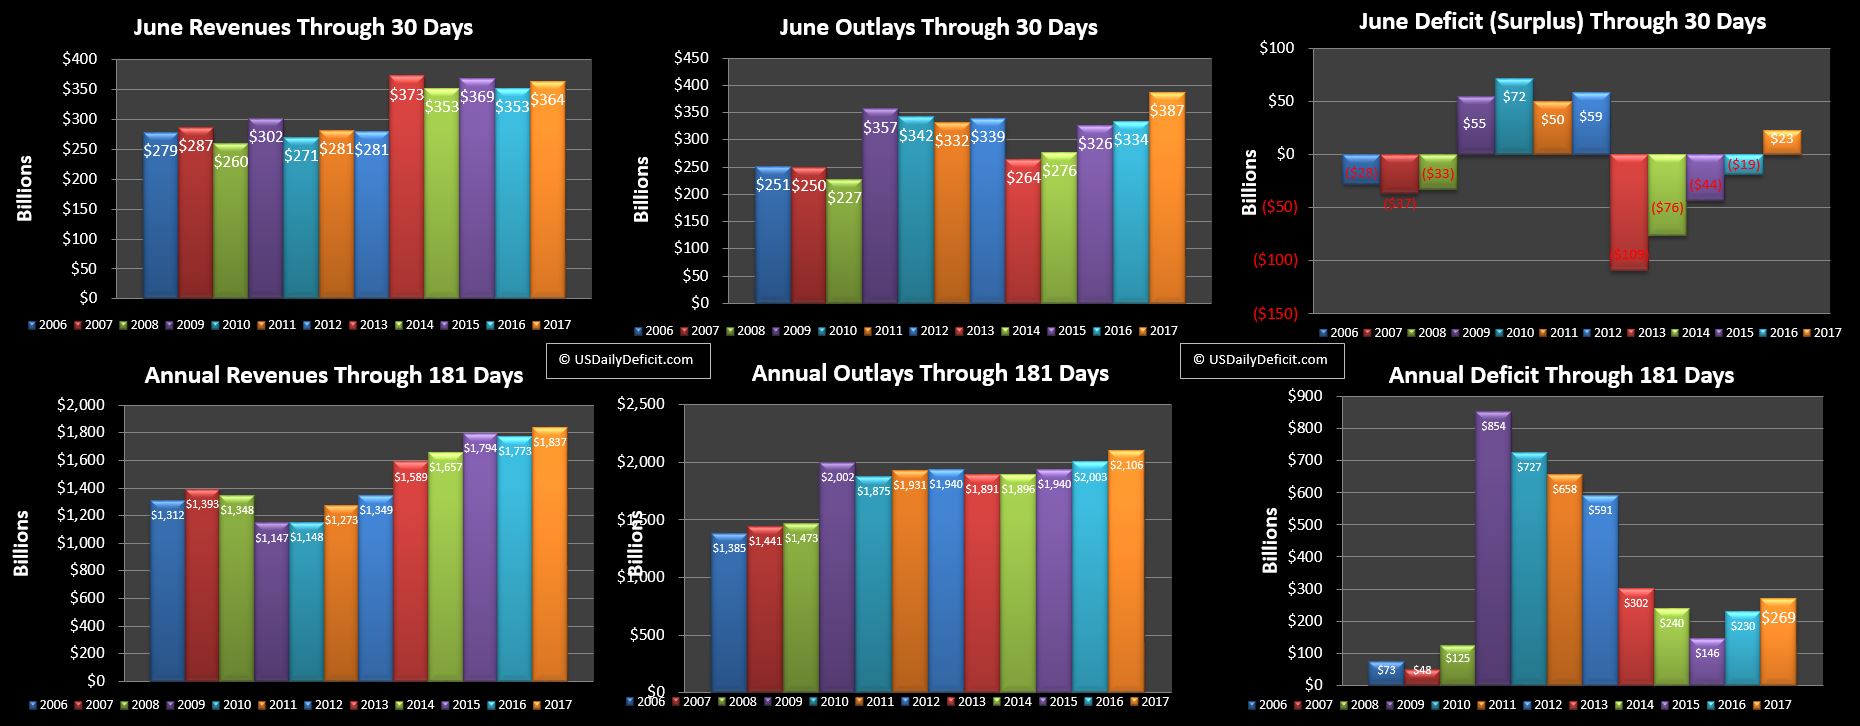
The US Cash Deficit for June 2017 came in at $23B compared to last Junes $19B surplus primarily due to timing. With July 1 on a Saturday, about $40B of cost that was due in early July was paid 6/30, creating an increase in June outlays that will be offset by a decrease in July.

If you put it adjust for that, 2016 and 2017 are pretty much running equal as 2017’s ~+3% growth in outlays has been offset by a ~+3.5% increase in revenue.

So far, no evidence of any real change being terribly likely in 2017…. no tax cuts, no infrastructure spending, no huge economic growth…just more of the same, not that I am complaining :)….it makes the forecasting a whole lot easier!! The second half of the year generally has much higher deficits than the first, so unless we start seeing some major changes, we are looking at another ~$700B deficit.


May 2017 Cash Deficit: $107B

By | Daily Deficit

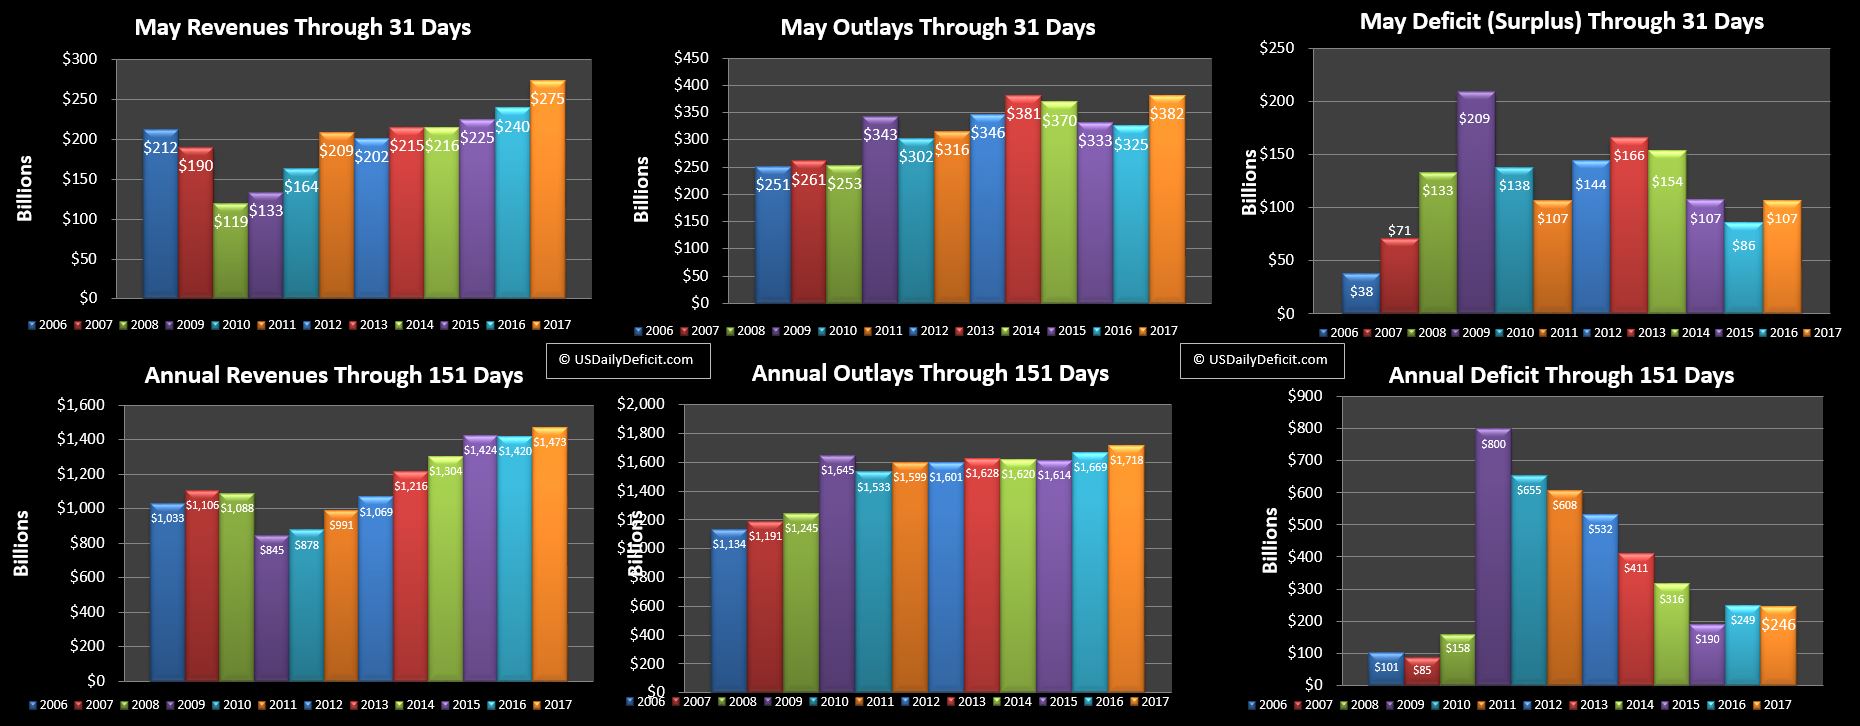
The May 2017 Cash Deficit came in at $107B.

That may not look great YOY, but the big expense spike was timing related, and expected. On the revenue side, we got a $20B bump from the FCC…I’m assuming spectrum auction revenues, and otherwise solid revenues with an additional business day as well…

Put it together and the YOY deficit through 5 months is actually down $3B as revenues are at +3.7% while outlays are up about 3%. I wouldn’t count on the +3.7% sticking…+2.0% looks a bit more realistic once you pull out the one offs, but regardless, here we are with a very slightly improved deficit. It’s still not great, but we’ll take it!!

April 2017 Cash Surplus: $206B

By | Daily Deficit

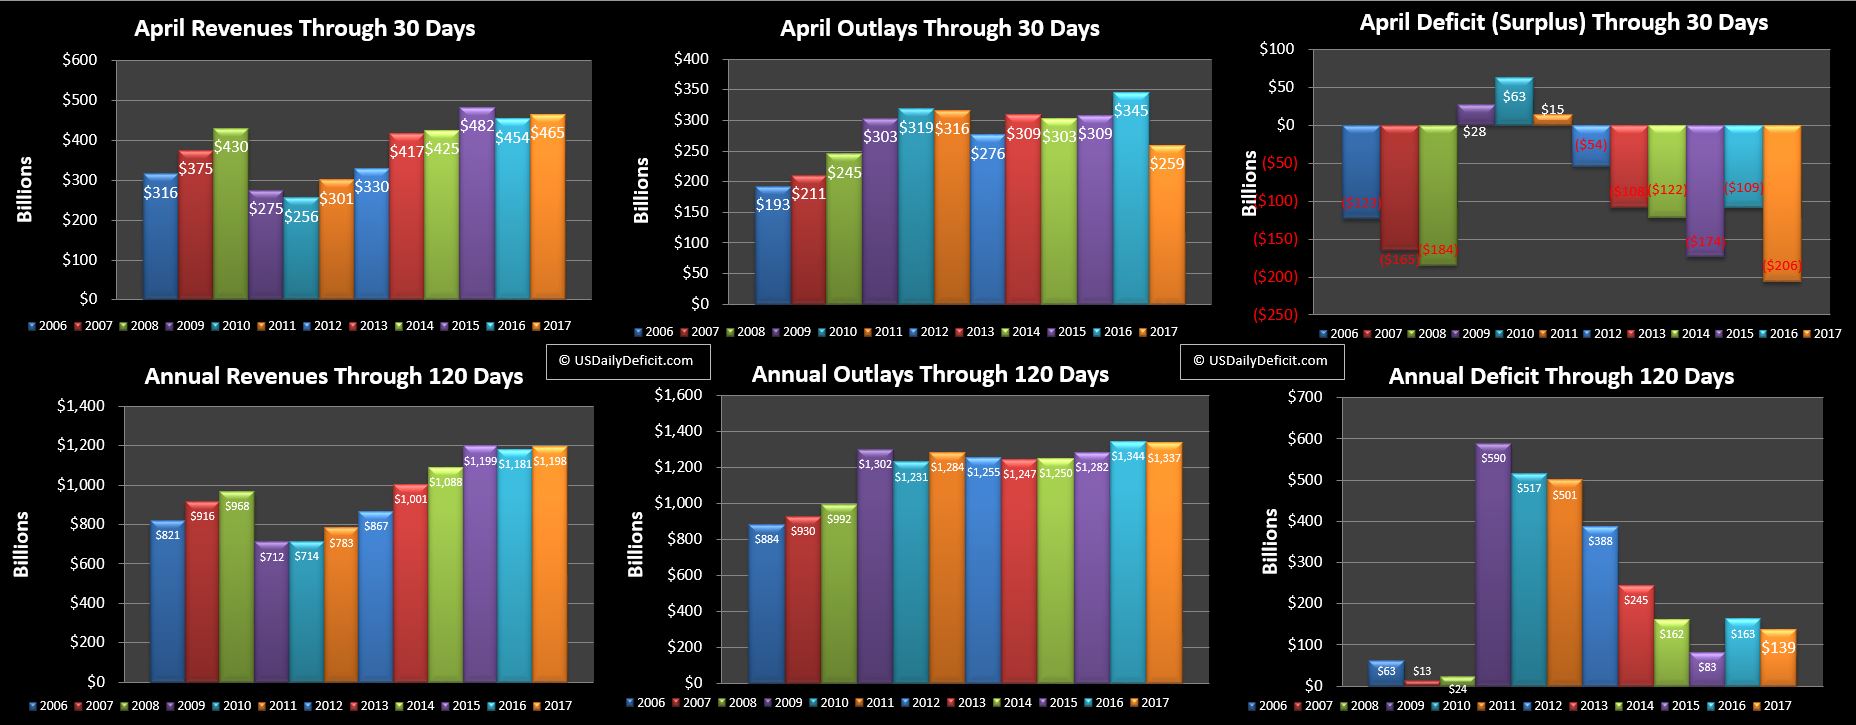
I can’t make any promises…time has been scarce as of late, but hoping to just post the chart today and give a more detailed analysis later.

Looking at the month, revenues were solid and timing issues compared to last year brought down expenses as expected, but don’t worry, we’ll be back to even 5/1. Regardless…A $206B surplus isn’t too shabby, so let’s enjoy it for just a moment :).

Looking at the year through 4 months, revenues are up about 1.5%, nothing impressive, but we’ll take it. The outlays are down, but that’s a little misleading, come tomorrow’s 5/1 report the timing issue will fall off and we should be back in the +3% range.

All together…this was a decent month…nothing earth shattering but sometimes simply not being terrible can be a really big win 🙂

US Cash Deficit-March 2017

By | Daily Deficit

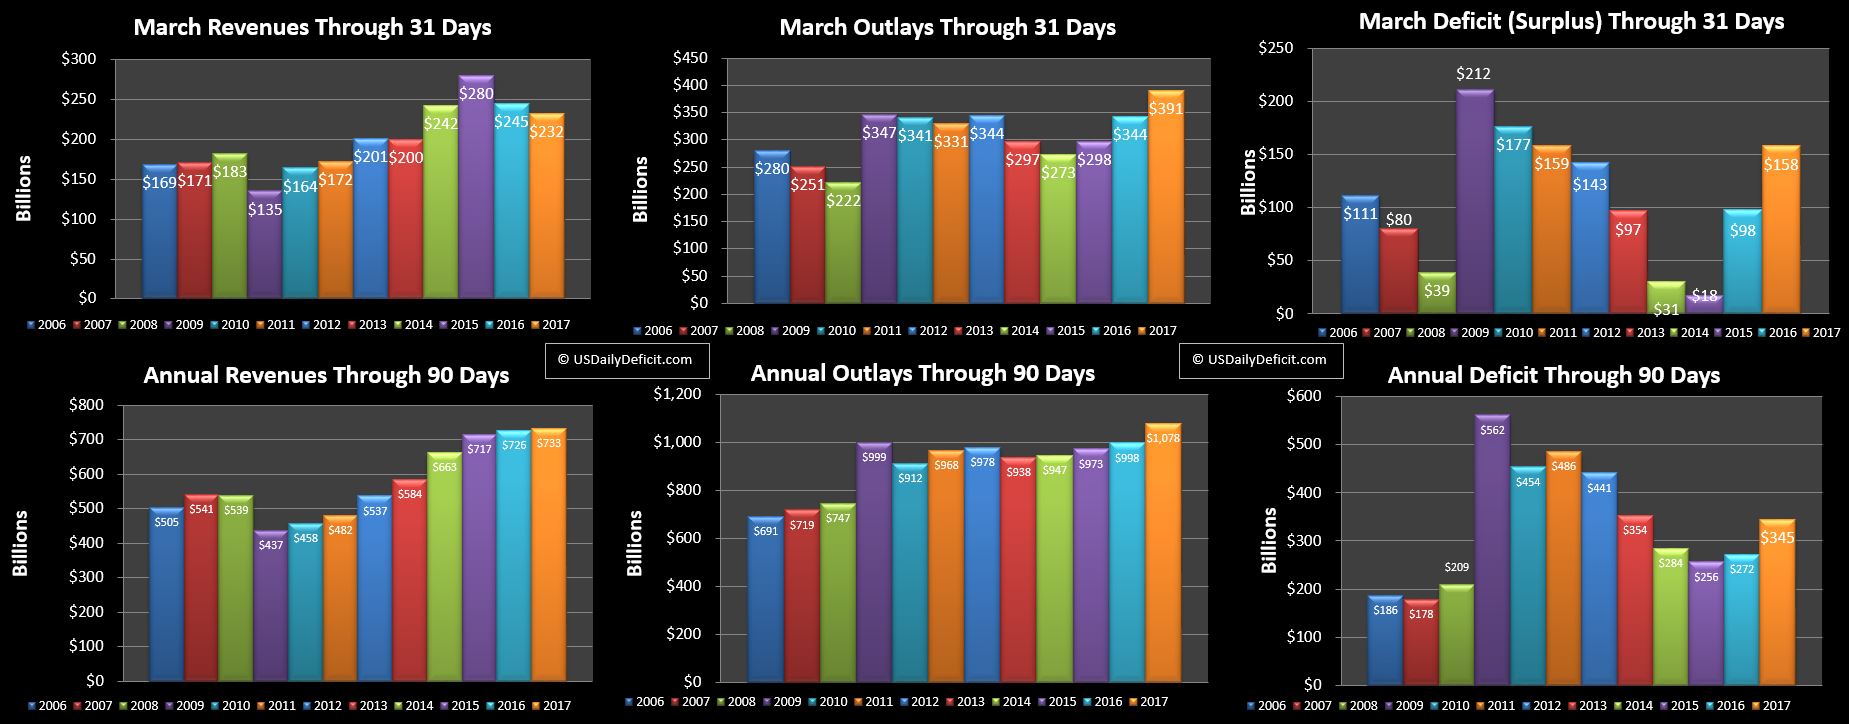
Running late so here’s the chart:

So that looks really bad….some of it was timing, but some of it was just plain ol’ bad…I’ll try to get a detailed write up out in the next week. Enjoy!!