All Posts By

copernicus

US Daily Cash Deficit 7/9/2015

By | Daily Deficit

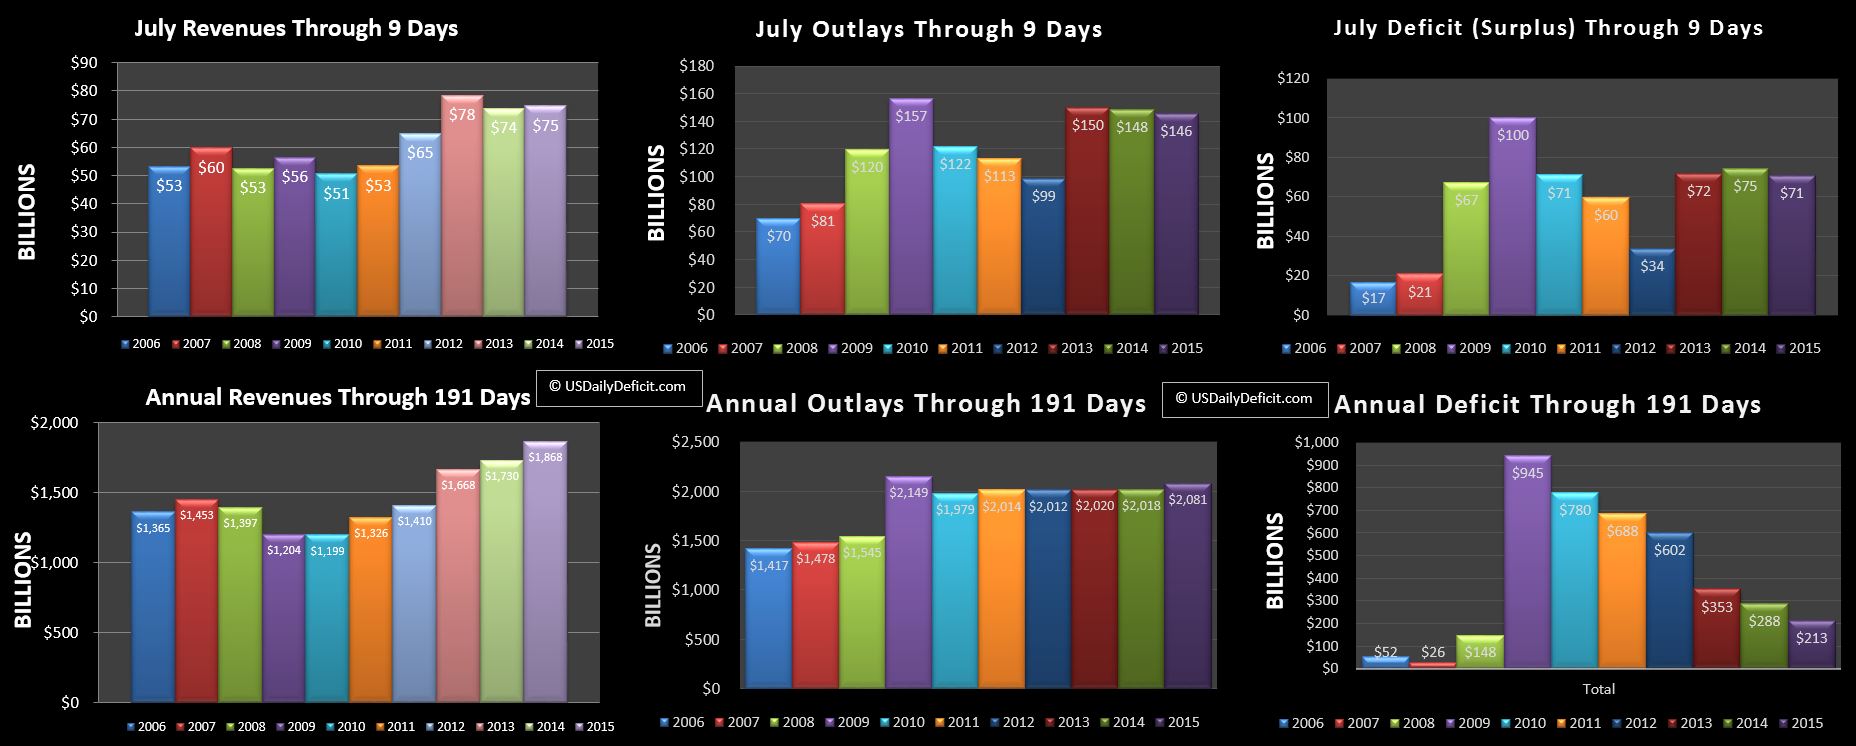
The US Daily Cash Deficit for Thursday 7/9/2015 was $4.8B bringing the July cash deficit through 9 days to $71B.

2015-07-09 USDD

We don’t really see much YOY change at this point, with revenues up a bit and outlays down a bit, leaving us with a $4B improvement in the deficit. It’s really too early to get excited about anything yet, but just to set the baseline, we really need revenue growth to continue to exceed 5% to keep making material progress in reducing the deficit, so this ~1% isn’t going to cut it. Fortunately, it seems like YOY gains typically show up in the second half of the month, so let’s give it a few weeks before we sound the alarm.

I’m getting a bit of a late start this month, so I’ll take a swing at the July deficit forecast with a bit of an advantage. I’m going to assume overall revenues grow at a base rate of about 5%, offset by about a $4B reduction in deposits from the Justice department we saw last year (bank penalties??) that I don’t think we will see again.  On the cost side, most categories will be roughly flat, with the exception of SS, Medicare, and Medicaid which together pull the apparent growth rate to the 3%-4% range. Finally, August 1 is a Saturday, which will pull somewhere between $30B-$40B of cost from August into July. When all is said and done, the July 2015 deficit should end up at about $115B , $29B worse than last July’s $86B deficit. Pull out the timing and we would have shown moderate improvement as revenue gains outpace outlays by a few percent.
Introducing My-Climate-Data.com Beta

By | Commentary

I’d like to take a minute to introduce another project of mine I’ve been working on for about a year now My-Climate-Data.com. About a year ago, a simple question popped into my mind….how is my  climate changing in Houston Texas? After an extensive search turned up absolutely nothing, I stumbled across the NOAA site here, where mountains of data are available for anyone with time to wait in a near infinite queue, or the patience to figure out how to convert thousands of tar.gz files to text and consolidate them into a useful database. It was a maddeningly complex process, but here I am a year later with the preliminary results….a functioning web site where you can find a site close to you, and with a few clicks be viewing the observed climate data in a pretty excel chart. At this point, I have temperature data for about 26,000 global sites loaded up and ready to go.

I encourage you to check it out, provide feedback, and tell everyone you know about it. This is just the beginning…I am currently working on adding precipitation, and about a dozen other metrics into the file to give you a complete picture of the climate history of over 80,000 global sites.

Screenshot below….do follow the instructions. It takes a while to load the Google Map with all of the sites….hopefully the redesign I am working on will improve this.:

MCD_HOME_SCREENSHOT

June 2015 Cash Surplus

By | Daily Deficit

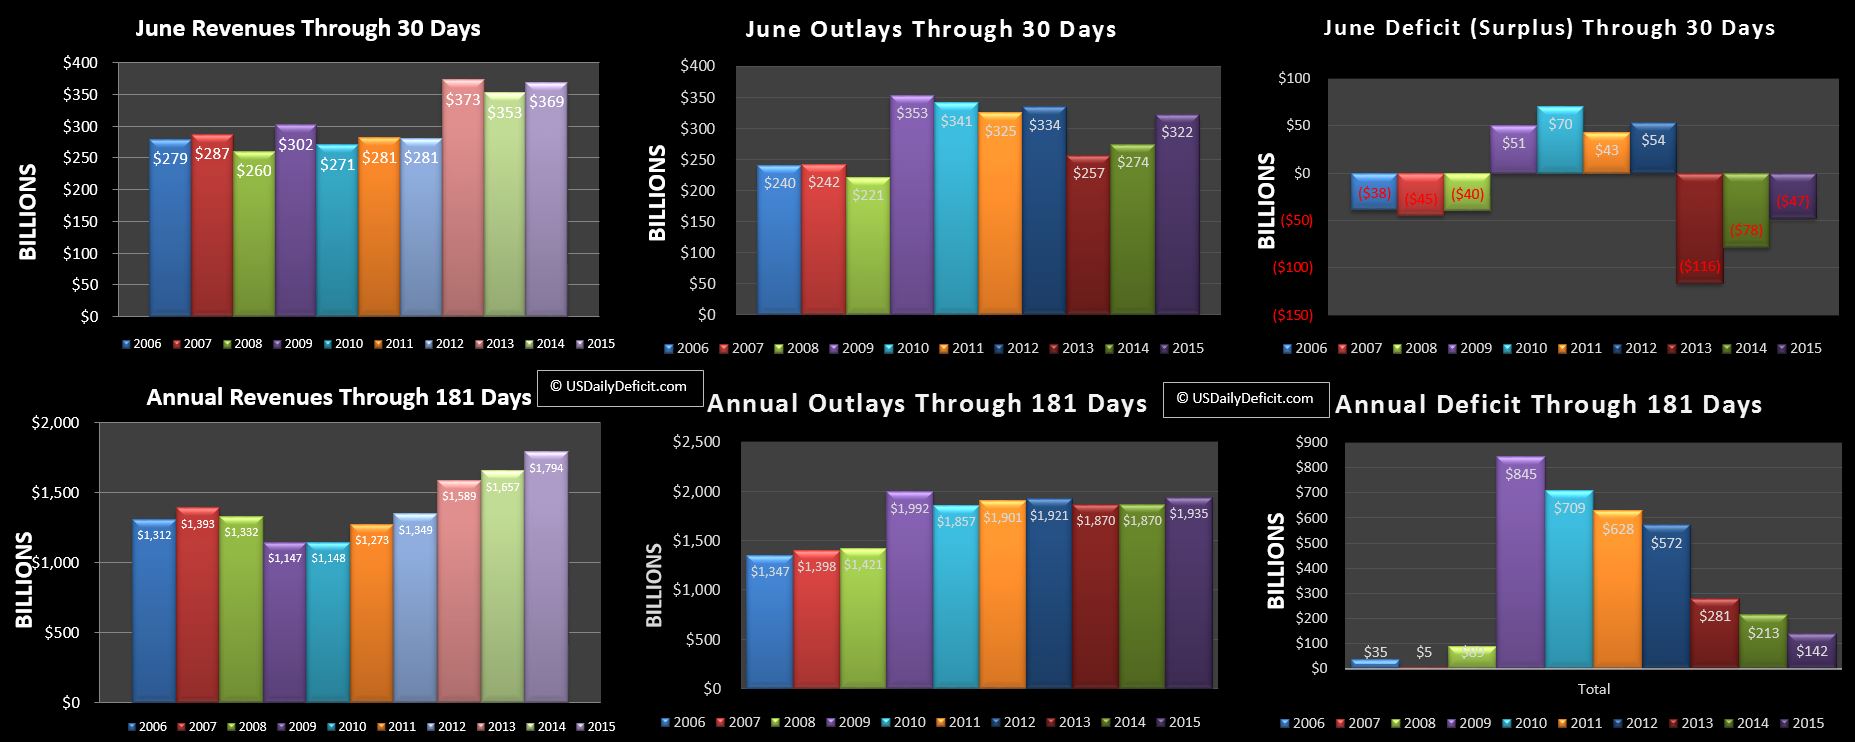
The US Daily Cash Deficit for Tuesday 6/30/2015 was $1.9B bringing the June 2015 Surplus for the full month to $47B, 3B short of my initial $50B forecast.

2015-06-30 USDD

Revenues:

Revenue ended up at +4.7% good for a $16B YOY increase. It’s not as high as we have seen, but it includes an $~8B reduction in GSE dividends, so I would still say this was a pretty solid month. Withheld Taxes were up 5.5%, taxes not withheld were up 7.4%, and corporate taxes were up 6.4%. For the year, revenues are at +8.3%.

Outlays:

Outlays ended up big at +48B, but about $35B of that was timing that pulled June 2014 costs forward into May. Another $7-$8B was likely the extra business day, and the balance was bonafide increases. no surprises there…Medicare is growing at 9%, Medicaid is growing at 18%, and SS is growing at a little under 5%. For the year, total outlays are running at about 3.5% in what appears to be a breakout from 5 years of flat spending.

Surplus:

At $47B was under June 2014’s $78B which was aided by the timing of outlays. Take that out, and a 4.7% increase in revenues edges out a 3.5% increase in outlays, for a marginal adjusted YOY improvement.

Default-Day:  We ended the month of June with $254B of cash, up from $199B to end May. Backing into the numbers, it actually looks as if “Extrordinary Measures” (EM) were down $15B during the month, bringing the total since EM was deployed in March back down to $115B out of an estimated $350B at their disposal, leaving a 235B cushion. Add to that the current Cash balance of $254B, and the total cash cushion at this point looks to be $489B, which should get us all the way to the middle of next February…so no real change there.

And that closes out a pretty darn good first half of 2015….revenue up 8.3%, outlays up 3.5%. It will be very interesting to see where the second half of the year ends up. It seems like most of the headlines point to economic headwinds…if they pan out we should see it in the revenue numbers, though they will likely lag a bit. As always…stay tuned

US Daily Cash Surplus 6-26-2015

By | Daily Deficit

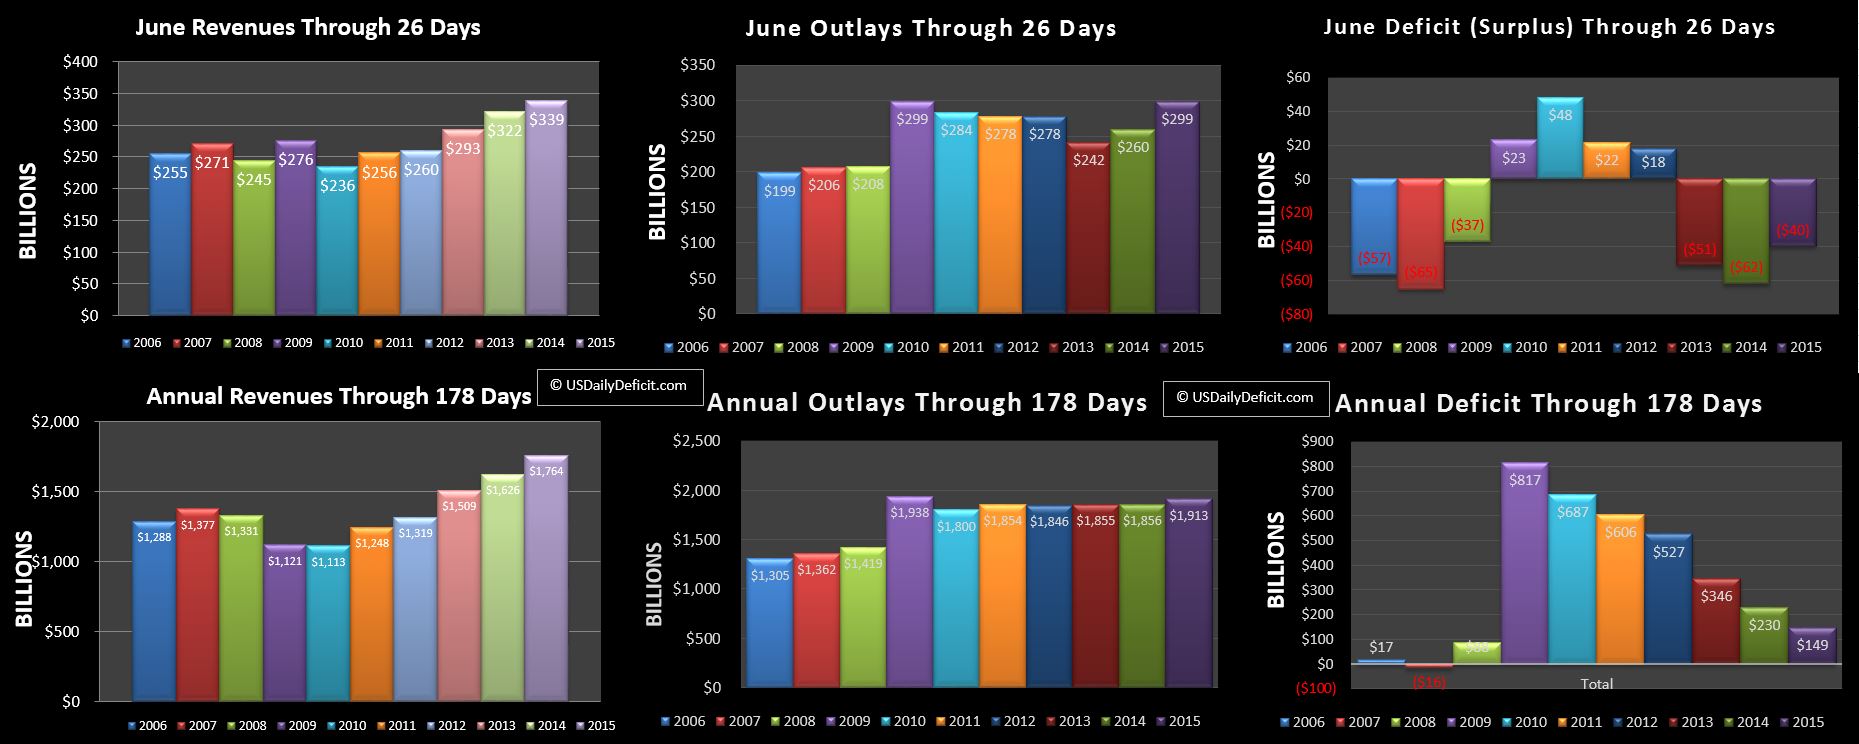
The Us Daily Cash Surplus for Friday 6/26/2015 was $0.4B bringing the June 2015 surplus with two business days remaining at $40B.

2015-06-26 USDD

Revenues are holding steady at about +5% while outlays, adjusted for ~$35B of timing are up about 1%. With most of the month in the bag, I wouldn’t expect a big swing from here, but revenue could edge down a bit as the reduction in the YOY Fannie/Freddie payments will likely overshadow the benefit of an extra business day. My initial forecast of a $50B surplus is still looking quite reasonable, but we won’t know for sure until tomorrow afternoon.

US Daily Cash Deficit 6/23/2015

By | Daily Deficit

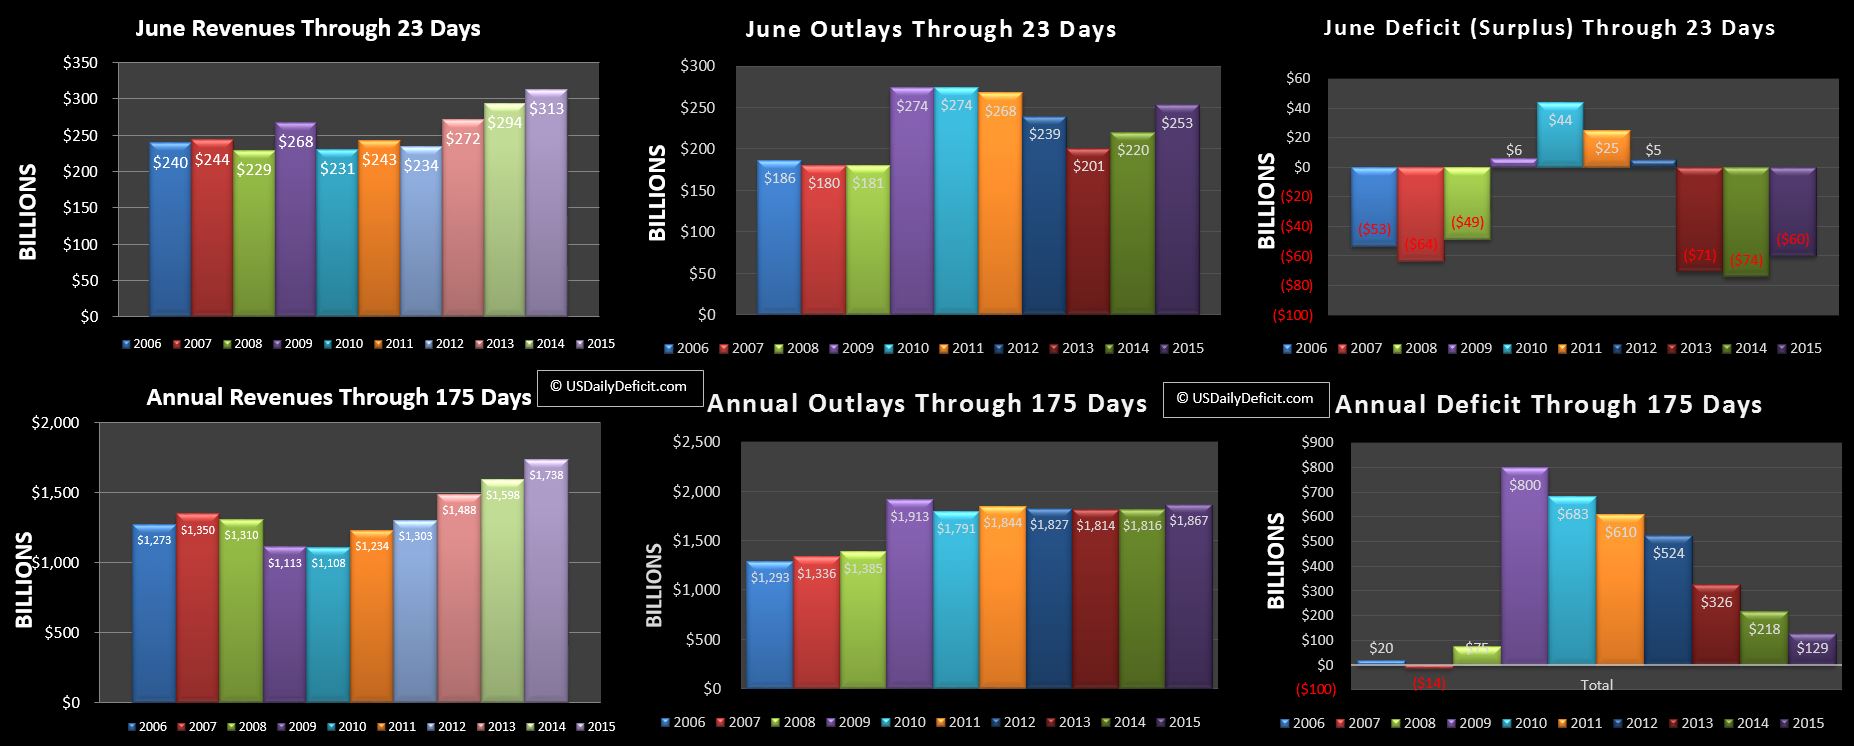
The US Daily Cash Deficit for Tuesday 6/23/2015 was $0.2B bringing the June surplus through 23 days to $60B with 5 business days remaining.

2015-06-23 USDD

With most of the action for the month in the bag, revenues are up 6.6%….not too shabby. We will likely end the month somewhere in this ballpark as an extra business day will be offset by lower Fannie/Freddie payments at the end of the month. So far, taxes withheld are up 3.6%, Taxes not withheld are up 5.3%, and corporate taxes are up 9%.

Outlays, adjusted for timing are pretty much in line with last year.

Looking to the YOY 2014 vs 2015, revenues are up 8.8% and outlays are up 2.8% as we approach the midpoint.