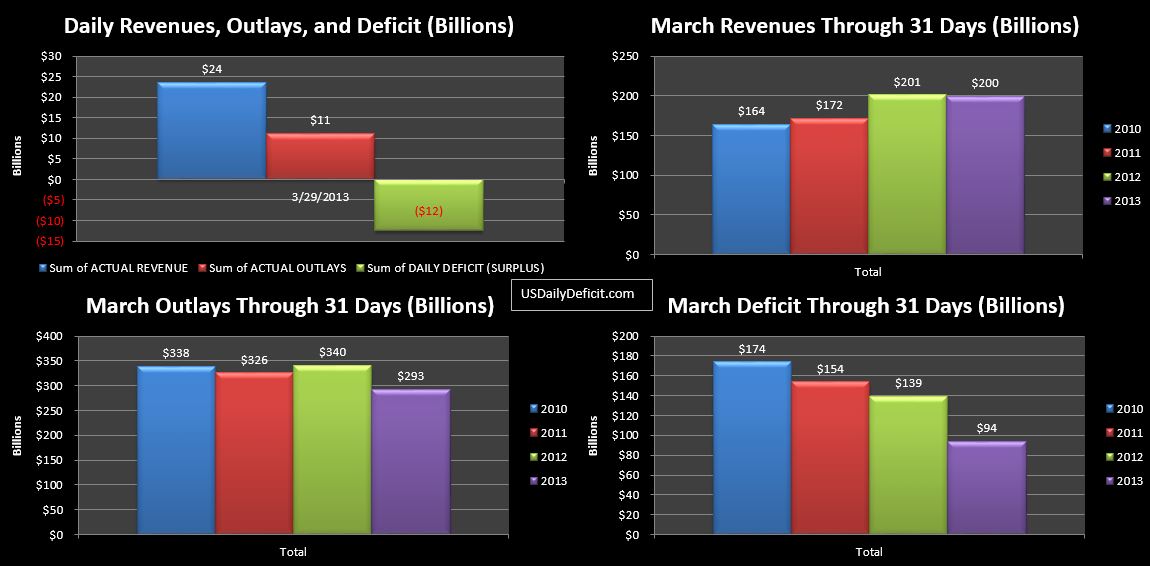
Here we go…the last DTS of the month, complete with a $10B surprise….an additional $10B of revenue from our good buddies at “GSE Dividends”. This is likely some of that missing revenue from earlier in the month…I guess they finally got around to cashing the check. The 3/29/2013 Daily Surplus came in at $12.5B, and the month ended up at $94B, a full $45B improvement over last year’s $ $139B deficit.
At first glance, revenues look flat, but the truth is, Corporate tax deposits were up 15% YOY and individual TD were up 12% for a combined increase of about $30B. This is offset by a decrease in TARP($15B), an increase in tax refunds ($10B) and about $5B decrease in other misc. revenues. This is good news….I have been using about 11% in my forecasts, so at least for the month, we are over performing. I won’t get excited yet…I really want to get beyond tax season and see how May-July looks…if we are still seeing 10%+ out there, it’s going to be hard to deny that we have some bona fide YOY revenue growth. Duplicating that in 2014 is an entirely different story, we’ll find out in time though.
Cost really jumps out at you with a $47B improvement, but about $30B of that appears to be just timing….costs that hit in late March in 2012 won’t hit until early April in 2013. Of course, that should give April 2013 a $30B headwind if it is going to improve upon last year’s $58B surplus, but with tax deposits showing strong growth, a strong showing on tax day (4/15) could make it close. That leaves a bona fide decrease in outlays of about $17B, which is quite impressive, maybe too impressive. Payments to defense vendors was down $6.3B from $33.8B to $27.5B. That doesn’t really jive with the sequester numbers I’ve been seeing, which was’t supposed to really hit until April or so…maybe they are just “slow paying” who knows…we’ll keep an eye on it. “Other also makes up a big chunk, and among the remaining categories, there is quite a bit of downward movement. It is worth noting that Social Security payments are up 9% YOY, posting a $5B increase from $55B to $60B in 3/2013. That $5B annualized means that just to stay even…we need $60B of revenue increases or spending cuts…every single year just to cover increases in Social Security.
So for a first glance, this is a better report than I expected, but it doesn’t warrant celebrations or a “Mission Accomplished” banner by any stretch. Tax deposits are definitely trending up, and outlays are more or less flat, maybe even down a smidge. If we keep this up, we may come in under the $1T deficit mark this year…maybe.
The Fairy Tale goes something like this…a rising stock market is good for the economy. As the market goes up, people have more money, spend more money, and the cycle continues. Sounds believable enough. Taking a step back in time back to the 90’s… I was in high school, and according to the news, everyone was getting rich investing in stocks. I recall one friend telling a story about an uncle or 3rd cousin or something who had gotten into day trading…apparently he could make $30k a day. It probably wasn’t true (or was only half true…he also lost $30k a day), but it just didn’t make any sense to me. I understood how companies made money…they produced a product and sold it. But when a stock goes up, where does the money come from? It just didn’t make any sense…it seemed like money was just being created out of thin air.
It wasn’t until much later, armed with the tools of the accounting trade that I was able to work my way through this logical fallacy. So let’s imagine that on a particular trading day, the entire stock market is complately flat, with the exception of one stock that pulls a clean double. It starts the day at $50 a share and a market cap of $1B, and ends the day at $100 a share and a $2B market cap. Hooray right? Without a doubt, the fortunate owners of this stock are ~$1B better off. But….back to accounting 101… for every debit…there exists an evil twin….a credit…somewhere. The reason the fairy tale persisists is because the credit is not as obvious as the $1B debit the owners of the doubling stock, but it exists nonetheless. The credit manifests itself as a type of inflation….while the owners of the stock are $1B better off….after this trading day, the owners of all the other stocks in the universe, and generaly every other person in the world, is just a tiny bit poorer.
The day before, anyone could have purchased the stock for $50…..now it costs $100. Nothing has physically changed in the economic universe. It is the same company, same employees, same manufacturing facility, same revenues, same cash flow….If the price of gasoline doubled, you would immediately recognize this as inflation, and feel a bit poorer, and while the mechanics in the stock market are identical, we tend to categorize this differently.
So I guess what I am getting at is that changes in the stock market do not create wealth, they simply reallocate wealth. We can see this in the clearly by looking at price fluctuations in a single commodity. When the price of oil rises, the relative wealth of owners/producers of oil goes up, while the relative wealth of consumers of oil goes down. These more or less wash, though I won’t pretend the economic system is so perfect that they wash to the penny. The exact same thing happens with individual stocks, or the market as a whole. So as we sit here in April 2013 with the DOW and S&P500 pretty close to “record” high’s (unadjusted for inflation of course), there is no doubt that for owners of stock, this is a good thing. But for the economy as a whole, it’s pretty much a wash. High stock prices are only good for the economy in the same sense that high oil prices are good for the king of Saudi Arabia. If you are the King…it’s not so bad at all. If you aren’t the king, and your tank is empty, it can kinda suck.
You probably are not convinced…a 5 minute blog post isn’t going to change decades of stock market mythology….all I’m saying is think about it. If the entire stock market doubled tomorrow…..would anything really change? Or would the rich just be richer and the poor that much poorer? let it marinate…I’ll probably bring this up again some day.
For bonus points…think about the inverse…the stock market instead tanks…90% tomorrow. Nothing else is changed. The factories, the infrastructure, profits revenues ect…. are all the same, but nobody wants stock anymore…Is it the end of the world, or just a reallocation event? What if it happens over a 10 year period instead of overnight. Write in complete sentences 🙂
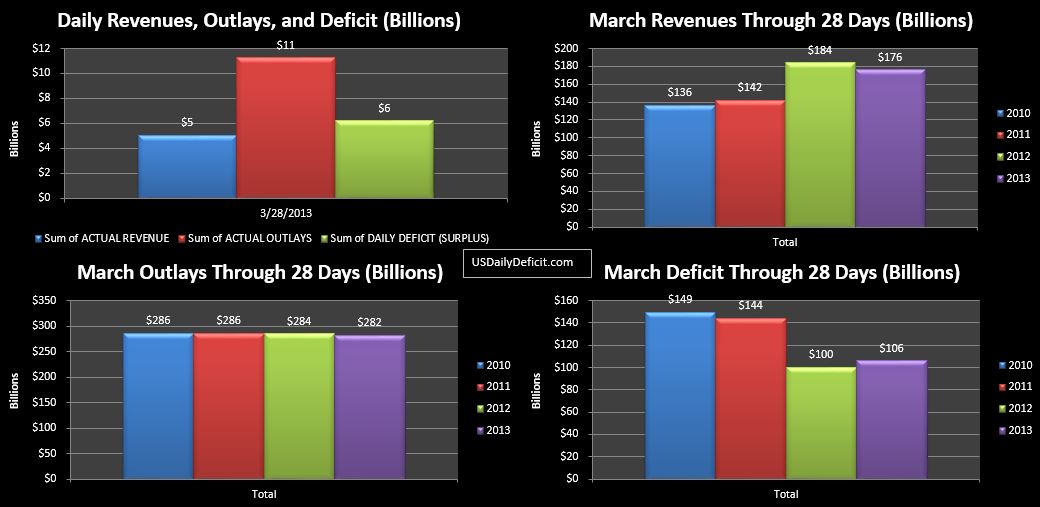
The US Daily Cash Deficit for 3/28/2013 was $6.2B bringing the monthly total through 28 days to $106B.


