CBO vs. CBO Round 1
As required by law, the Congressional Budget Office released their semi-annual 10 year budget forecast last month, projecting a $6.825T deficit between FY 2013 and 2022. Over that period, debt held by the public (excluding Intragovernmental debt) is projected to increase $7.6T from $11.3T to $18.9T to end FY 2012. On its face, that sounds pretty terrible, though it is a marginal improvement over the last 10 year period where debt increased $7.7T from $3.6T at the end of FY 2002 to $11.3 at the end of FY 2012 according to the US Treasuries Debt To The Penny web site.
That the CBO has a spotty record is no secret, including their famous projection in 2000 that the debt would be eliminated by 2010, missing that one by about $7.5T. To be fair, it’s not all the CBO’s fault. Their masters in congress dictate that they use predetermined assumptions…regardless of how unlikely those assumptions are. In any case, while this forecast is definitely an improvement over the August-2012 release which forecasted a mere $2.3T deficit between 2013 and 2022, it still struck me as wildly optimistic, particularly on the revenue side, where they have revenues increasing 93% from 2012 to 2022, despite the last 10 year period only increasing 46% from 2002 to 2012.
All of this got me to thinking…could I, a simple citizen-accountant with a small deficit blog, do a better job forecasting the 10 year deficit than the mighty CBO, with their legions of TPS processing bureaucrats? We won’t know for 10 years, but below is my personal Budget Outlook for 2013-2012.
Methodology:
My preferred source of historical data is the Daily Treasury Statement (DTS) which provides a daily snapshot of cash inflows and outflows, uncorrupted by the so called “principles” of government accounting. From the DTS, I have identified 19 cash revenue streams and 35 categories of cash outlays. For each, I have created an interactive forecast of the next 10 years by month, taking into account seasonal patterns and historical rates of growth. One key assumption is that interest paid on public debt stays around 2%. For more on methodology see related posts on my blog USDailyDeficit.com here
Revenues:
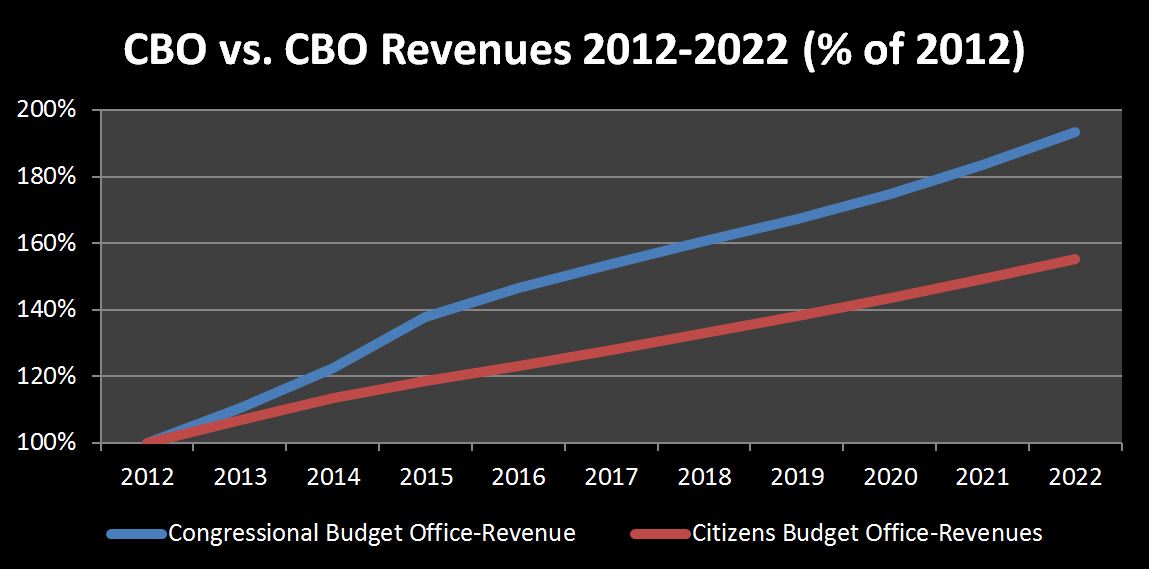 This chart gives us 2013-2022 projected revenues as a percentage of 2012 actuals. The Congressional Budget Office projects revenues to grow at 11%-12% per year from 2013 to 2015, before tapering down to a 4%-6% for the rest of the forecast period. I think this is quite optimistic, especially for 2015. 2013 does get a one-time bump due to actual tax hikes on income and payroll. However, I have a hard time seeing this repeat for 2014 and 2015 without significant additional tax hikes in the $200B per year range, or $2T for those who prefer their tax hikes presented in decades rather than annualized. At this time, that just doesn’t seem realistic to me at all. Over the forecast period, the Congressional Budget Office forecasts revenues to increase 93% from $2.449T in 2012 to $4.734T in 2022. My forecast comes in at 55% growth over the same period. For reference, over the prior 10 year period, 2002 to 2012, revenues increased by 46%.
Outlays:
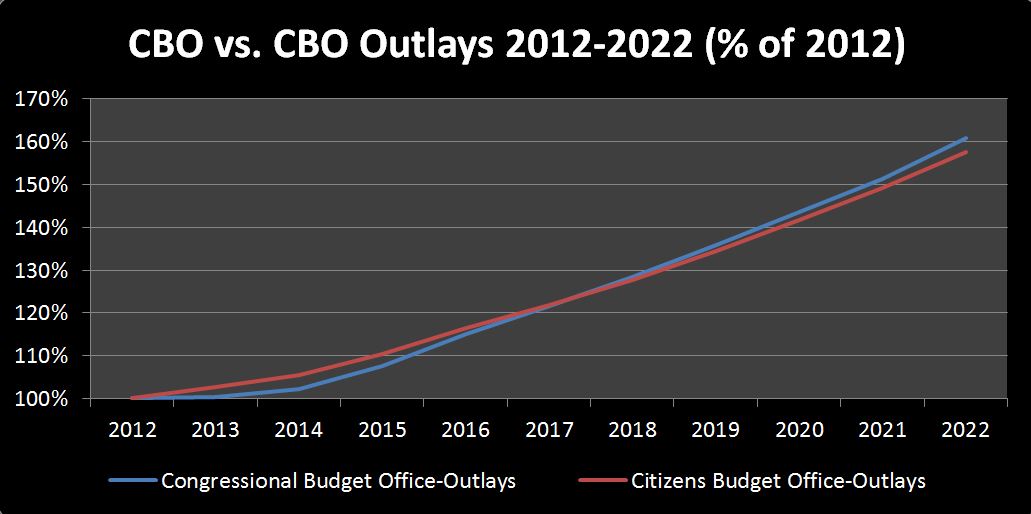
The Outlays chart is presented again with 2012 as a base and the forecast years as a percentage of the base. While the forecasts look surprisingly similar, the internals reveal some big differences. The key difference is the expected interest rate. I keep interest rates constant at 2% over the forecast period, while the CBO keeps rates at 2% through 2015, before gradually increasing to 4.2% by 2022. The result is that while I forecast public debt at the end of 2022 a full $5T higher than the CBO, they have 2022 interest expense at $795B vs. my forecast $452B. On the other hand, for the remaing outlay categories, I am projecting a growth rate that exceeds the CBO’s forecast, coincidentally just about completely offsetting the lower interest expense I am forecasting.
Deficit:
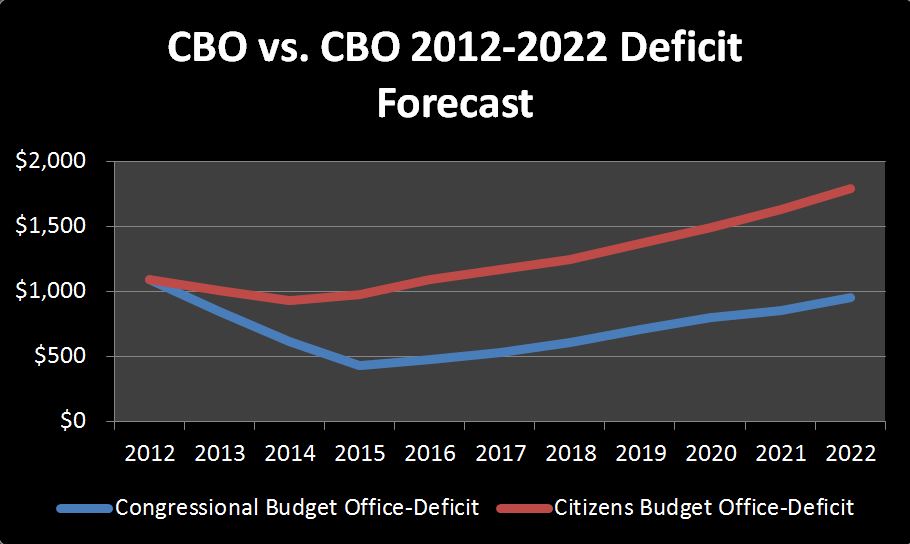
Once you have revenues and outlays forecast, the rest is pretty simple math. The CBO has the deficit decreasing from $1.089T in 2012 down to a low of $430B in 2015 before picking back up as the pace of outlays increases faster than revenues, ending 2022 back neat $1T. Over the 10 year period, the total deficit forecasted is $6.825T. My forecast shows slight deficit improvements in 2013 and 2014 before swinging back in 2015 and accelerating to $1.788T by 2022, for a 10 year deficit of $12.7T, $5.875T worse than the CBO’s forecast.
Debt:
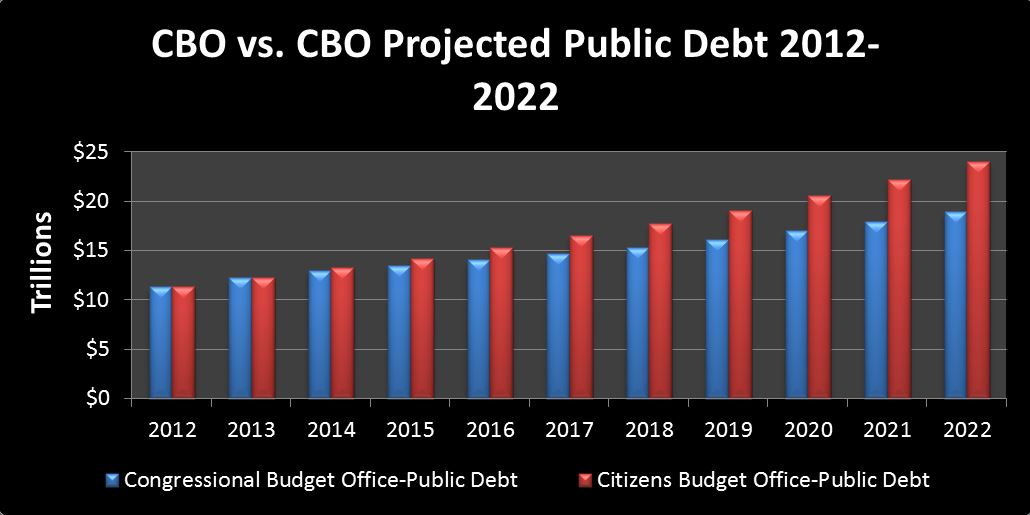
Since we come to very different conclusions on the 10 year deficit, it should be no surprise that we also come to different conclusions about debt outstanding. While the CBO forecasts public debt outstanding to be $18.902T, I forecast it will be $23.972, a more than $5T difference. For me, this is where the rubber meets the road. Even today, US treasuries are seen as the gold standard of bonds, being priced as if they were nearly risk free. As an investor,I think you have to ask yourself “For how long?” When does the market start to question the ability of the US to repay her debts? Is it when we hit $20T in May of 2020? Five years later in October of 2025 when we smash through$30T? Or is it sooner, perhaps this summer when the debt limit battle resumes after a brief hiatus? If we happen to make it to 2022, whether our debt is at $19T or $24T, the reality is, it only gets worse from there. Even if you missed Greece, Italy, Spain and Cyprus, for the US, the writing is on the wall.
Conclusions:
Congress is stuck between the proverbial rock and hard place. In The Spending Problem I compared 2007, the last year we came close to running a surplus, to 2011, when we ran a $1.3T deficit. Over that period, while population increased about 5% and revenues were nearly flat, outlays increased 36%. This created a new and unsustainable baseline that we will never “grow” our way out of. It is quite clear that spending is the problem and that cutting spending is the solution. However, those trillion dollar deficits, going on five straight years, are literally the only thing keeping GDP positive and “official” unemployment in the single digits. Pulling $1T of government spending out of the economy now, or ever, is almost guaranteed to reduce GDP by more than $1T, maybe by a lot more. So, politicians have two choices.
1) Fix it now. Cut spending by around $1T per year to get it back in line with the pre-2007 baseline. This will pre-empt the impending debt crisis, however,it would immidiately tank the economy, putting countless people out of work, infuriate huge voting blocks, and it only gets worse from there. With some really good luck, in five years or so, the economy recalibrates itself, finds a new equalibrium, and we all go on our merry way, though this is in no way a sure thing.
2) The second option is to stay on the current path, borrowing more and more each year just to keep GDP in place. Public debt outstanding surpasses $15T, 20T, 25T. Nobody knows where, but somewhere along the line, the house of cards simply falls apart. When that happens, and it will, lookout because the market is going to do a nosedive that makes 2008 feel like a pillowfight.After that, we pick up the pieces and more or less start over from scratch, hopefully.
Given that the time to really fix anything probably passed a few years ago, and recent squables have only led to inconsequential cuts and revenue increases, The likely outcome is clear. We will kick the can until it is no longer possible. In the meantime, you can be assured that I will not be loaning Uncle Sam any money.
I have one more interesting conclusion related to interest rates that should interest everyone. The Federal Reserve’s storyline for quite a few years now has been that they are keeping interest rates low to help stimulate a recovering economy, lower unemployment, encourage lending, ect. I’ve suspected this for a while, but after completing this analysis, I am convinced that all of that is just a cover story. The truth is, they have no choice to keep interest rates low because if they don’t, the federal budget would instantly come apart at its seams.
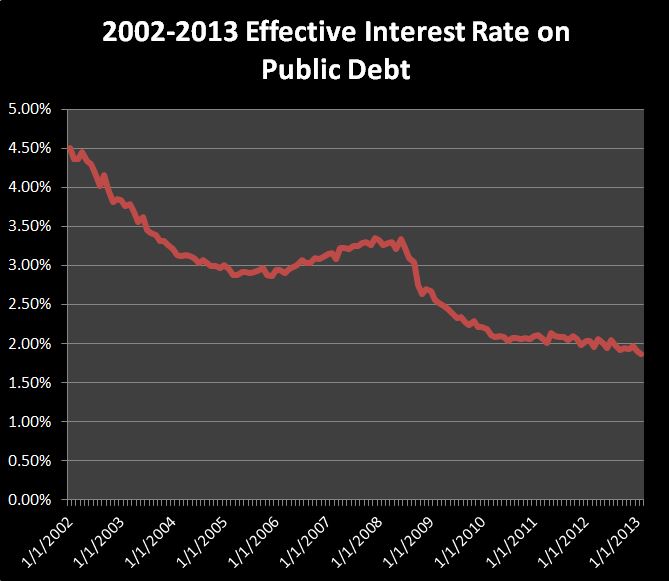
In 2012, the US paid $223B in interest on $11.28T of public debt, for an effective rate of 2%. If that doubled overnight to a very historically reasonable 4%, and we applied it to our model it would have added an additional $4.5T to the debt in just our ten year forecast. This is due to the additional outlays, which are of course financed, which pushes up interest expense, which increases outlays, and the cycle repeats itself. Albert Einstein is rumored to have once said that compound interest was the most powerful force in the universe. This may be true for savers, but for debtors, quite the opposite is true. As the example above illustrates, the inverse is that compound debt can be one of the most destructive forces in the universe.
I have to assume that somewhere at the federal reserve is an accountant just like me, but with better data and a lot more time cranking out “real” budget forecasts that give Ben Bernanke and President Obama nightmares. If I am correct, it means that interest rates are never going to increase so long as the Federal Reserve has control of the market. They can’t do it now with $11.9T of external debt, and they surely won’t be able to do it in the summer of 2016 as we are cruising past $15T and the presidential campaigns are in full swing. Since they can’t voluntarily raise rates, I will be watching this chart as an indicator of when they start to get raised involuntarily.
Catch up (June/July 2018 Cash Deficit)