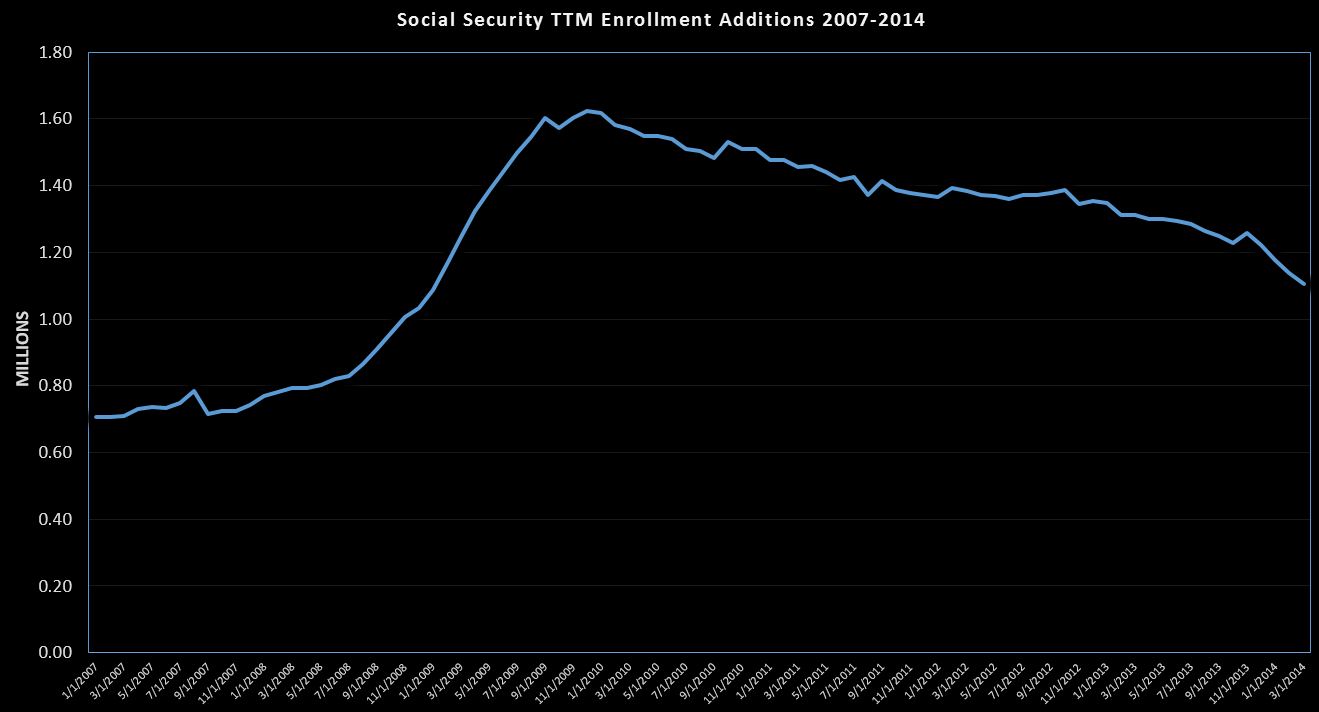
In February, the SS rolls added 120k people….up from January’s 103k, but down from February 2013’s 159k add. February is typically the largest add of the year, so no real surprises here.
The above chart shows the TTM change starting in 2007 with an annual rate of about 700k, spiking to 1.6M in 2009, and trending down since. We are still well above 1M at 1.138M, but we have 4 months of decline…note that this is just a decline in annual additions…we are still adding at a historically high rate, just not as high as the peak of the recession. That said, the 4 month trend does look steeper than anything we’ve seen since the peak. Perhaps Boomers close to retirement are deciding to stay in the labor force a bit longer….holding the rate down for now, and ultimately increasing their payouts.
Looking to the cash outlays on the DTS, YOY growth comparing this trailing twelve months to the prior shows about an 8% growth which is made up by growth in population, COLA increases, and by an increase in average payouts….driven by new enrollees having higher monthly payouts than the existing population….for example in a given month an 85 year old recipient with an $800 monthly payment passes away and a 66 year old recipient files for the first time with a $1500 per month payment…..population stays the same, average payout goes up.
The primary reason I monitor this is to spot the early stages of a new recession driven spike in enrollment…. If anything we see exactly the opposite, which is the same sign we are getting from surging tax revenues for going on 2 years straight. Very curious….

Catch up (June/July 2018 Cash Deficit)