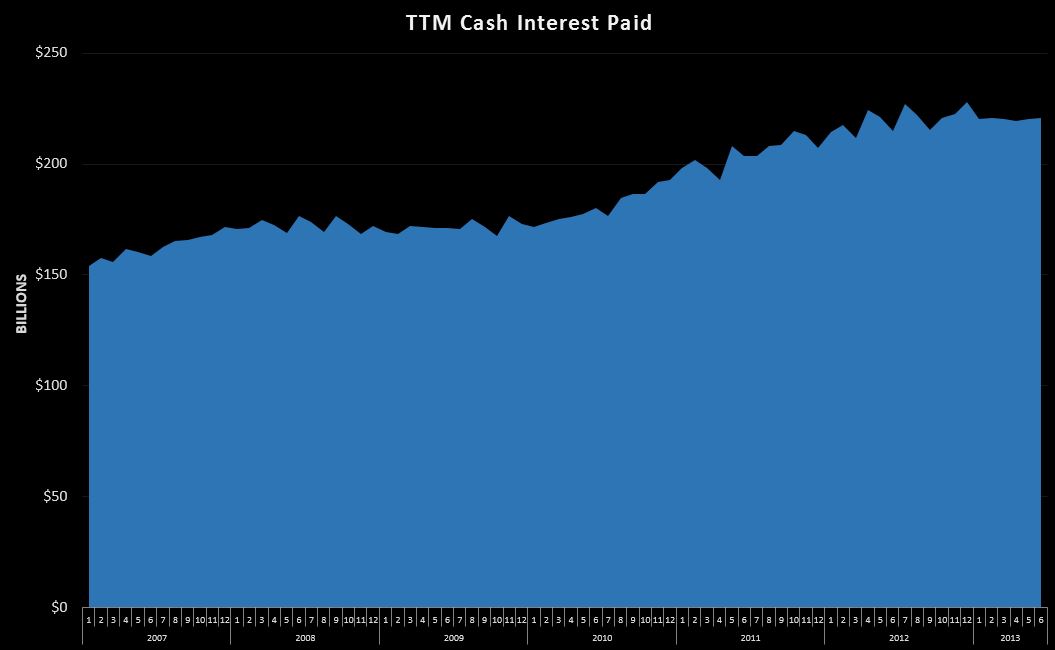
At $221B over the last 12 months, cash interest paid on the public portion of the debt isn’t huge…it’s about 5% of all outlays, but it holds an incredibly important role in the future of the debt/deficits. To fully understand why…let’s go back about 6 years to the beginning of 2007. Public debt outstanding was at $3.8T, and annual cash outlays for interest were at $152B. Fast forward to the end of May-2013…where public debt outstanding was $11.9T with the aforementioned $221B of cash interest payments. Does that sound a bit off to anyone?
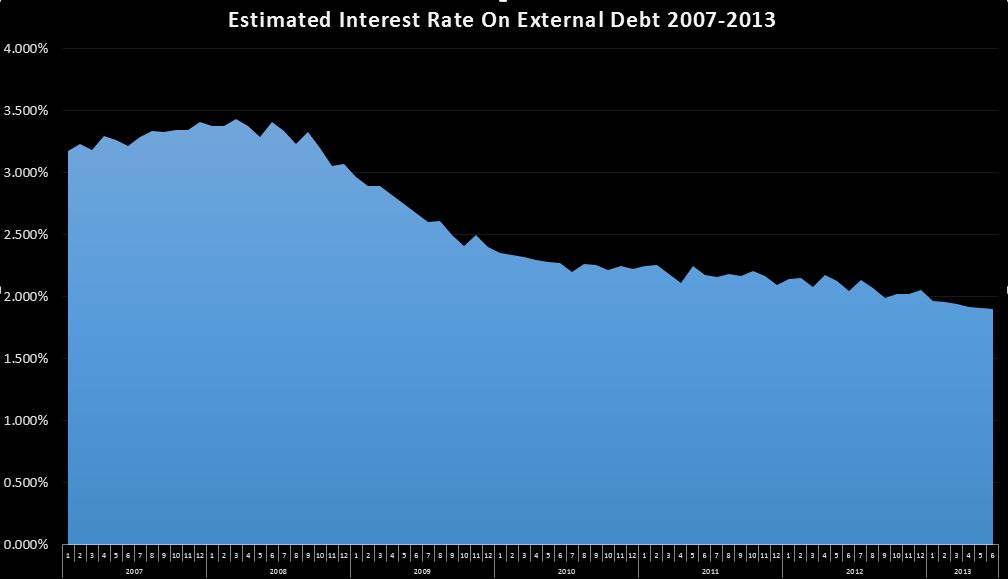
It should…Over the same time period that publicly held debt outstanding has more than tripled, cash debt payments has only increased 45%. It’s a really sweet deal….if you can get it…and by actively manipulating the market (screwing over savers in the process) that is exactly what the government has accomplished. The key, of course, is lower rates…declining from an estimated 3.2% in 2007 to about 1.9% as of the end of May. I say estimated…I take the TTM cash payments, and divide it by the average public debt outstanding over the prior 12 months. No…it’s not perfect, but applied consistently I think it tells right story with an acceptable margin of error.
So some quick math…just say we can assume 2007’s 3.2% was a “normal” number….something we could plug into a 50 year forecast. I’m not sure it is, but let’s go with it. At that rate…we would be spending $380B per year on external interest payments…$160B over the current run rate. Over the 10 year timeframe our congress critters seem to prefer….It would be a lot more than $1.6T due to the magic destruction of compound interest. This in an era where we can’t even agree on simple cuts that will only save a few billions a year.
It has long been my theory that this is the true primary reason behind low interest rates. Not stimulating lending, or the economy, or making housing affordable…those are all just cover stories for this….manipulating interest rates down to near zero is the only way in hell the government can afford to finance the budget without the whole thing blowing sky high. That is why my thesis is that they simply cannot allow rates to go higher at all, and so when they invariably do go higher…it indicates that the Fed has lost control, and things could get very ugly very fast.
This is why I believe this is one of the most important charts I track each month. Once that curve starts to head up and crosses 3%…the long term deficit is going to take off, exposing what has been obvious for quite a while anyway…the US government will default on on and off balance sheet debt sooner or later….the only question is when, and who gets screwed the most (Seniors, veterans, government employees…all of the above?).
So…if you’ve been to a finance site recently…you’ve probably heard that rates are headed up across the board. Is this the end?? Well…let’s look at some data. It looks like…from yahoo finance, that the 6 month bond has increased 50% from .06% to .09%. That’s an incredibly low rate….so bumping it up 50% is more or less inconsequential for now. Say $1T of the $11.9T debt is 6 months or less….assuming I have my decimals in the right place…that’s only $1.2B per year at .06%…or $1.8B at .09%….rounding errors really.
Obviously, the 6 month is only a small piece of the market, but I think the illustration works for the entire spectrum…extremely low rates have increased a bit in the last few weeks, but are still extremely low. Furthermore….the $11.9T of debt is fixed for terms of days, up to 30 years…. so while bondholders are immediately affected by rate swings, treasury more or less only has to worry about the debt it is rolling, about $600B per month(primarily short term), plus any new deficits that need financing…say $75B per month. To further complicate things, we are using the cash interest payments, which are going to lag issuance by up to 6 months.
So…for now, while it’s not a good sign, I don’t see the action in rates over the last month creating an immediate crisis, but perhaps sowing the seeds for an inevitable crisis down the road. It will be months before these rather small (in the big picture….maybe not so much if you were betting with leverage the other way) increases in rates flow through to cash, and even then they probably won’t be noticeable. Still….very interesting stuff to keep your eyes on. I’ll probably start sounding the alarm when the rate creeps back up past 2.25% and looks like it is trending up. Given the vast size of the market…this isn’t going to happen overnight. Even if the seeds have indeed been sown in the last few weeks… I think it could be a year or two before enough debt is rolled at higher rates to start seeing a materially higher cash interest expense. I guess when it comes down to it, we all know how this parade ends….it’s the timing that we aren’t sure about.


Catch up (June/July 2018 Cash Deficit)