Tag

us deficit

January 2015 Update: Social Security Enrollment

By | Commentary

It’s been 7 months since my last SS update, so first a quick refresher. SS is a broad program best known for the retired worker program…..where you pay in a portion of your paycheck each week, and in return, will hopefully get a monthly check once you reach~65….for the rest of your life. As of January, there were 39.1M retirees collecting an average of $1,331 per month, which pencils out to $52B per month, or $625B per year. This population is growing at about 1.1M per year…that is new retirees less deaths of existing enrollees = 1.1M per year.

Moving on…the second largest piece of SS is Disabled Workers, with 8.9M people receiving an average of $1,165 per month. The balance is about 10 smaller categories of children, spouses, widows etc…. of retirees and disabled workers. Each month, the government releases a report here that details the new monthly totals, their average monthly benefit, and even the Male/Female split if that interests you.

Any one report isn’t all that useful, but by compiling them and tracking the monthly and annual changes, one can squeeze some useful, or at least interesting data out of them. I track them for two primary reasons. First, SS is a huge part of the cash deficit, …$773B over the last 12 months ending in January, good for 20% of cash outlays, and growing at 5% per year. Supposedly, at some  point over the next 5 years, we should start hitting the meat of the Baby Boomers, resulting in a notable increase in enrollment and cost….I want to see it in real time.

Second, as you will see in the charts below, there is a noticeable correlation between the state of the economy and the SS enrollment rate. In the “Great Recession”, we saw enrollment rates more than double from 2007 to 2009. Again, this series gives us a real time window into the decisions millions are making…. It may or may not be a leading indicator, but it is certainly worth watching because if we have another spike, whether from the boomers retiring or a recession, it will have a noticeable affect on the deficit.

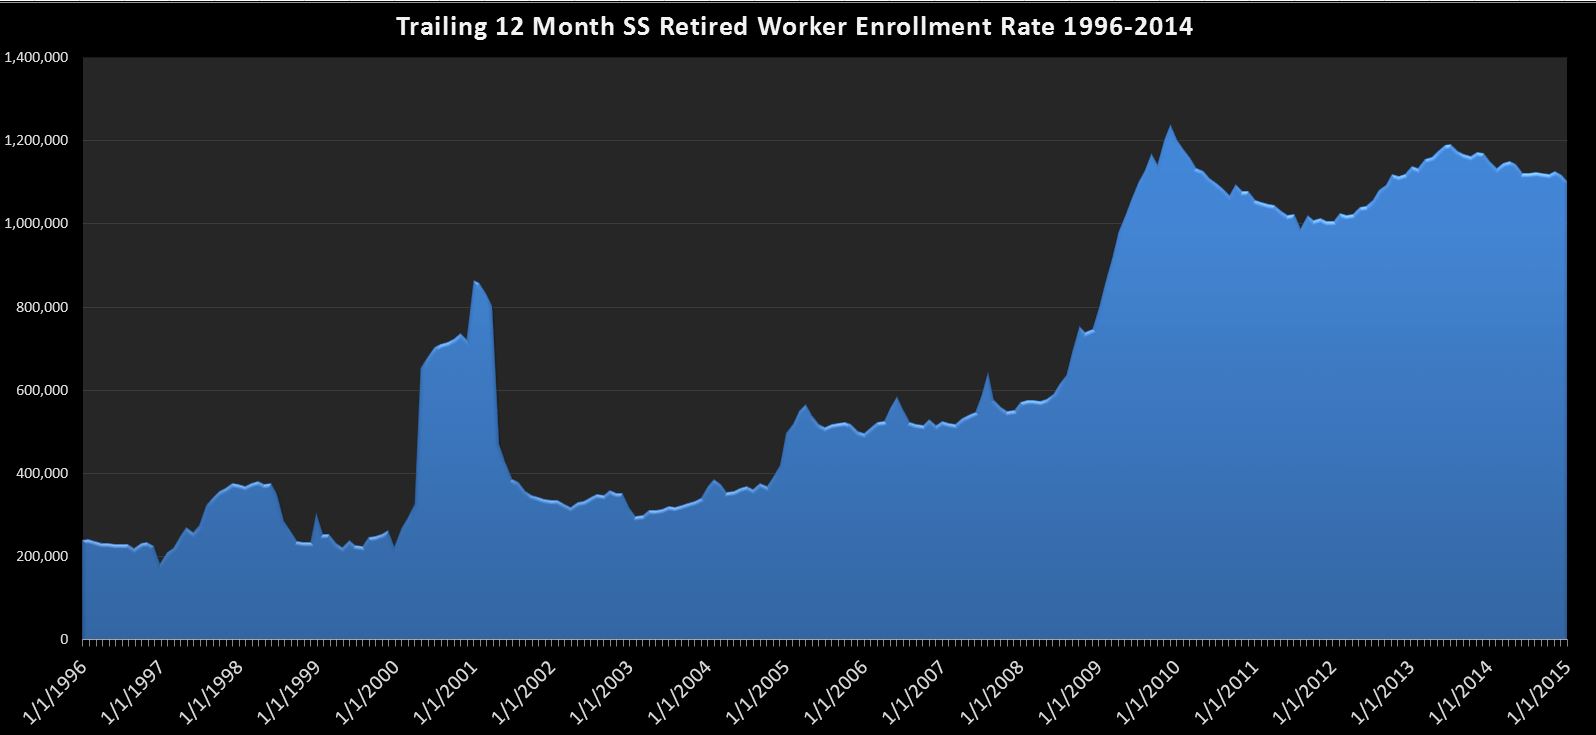
First up…just the retired workers chart:

2015-02-24 SS-Retired Workers

Here we can see the relationship between the economy and the rate of SS enrollment with a spike in the 2000-2002 time frame and again in 2008. Since then, it has remained elevated, but is slowly trending down over the last ~1.5 years. It’s still pretty bad…at over 1.1M per year, but really no material change since my last report, so i guess that’s a good thing. If…or when we see this swing back around and start heading toward 1.5M….you can be sure trouble’s a’brewin.

Next, we look at the whole program:
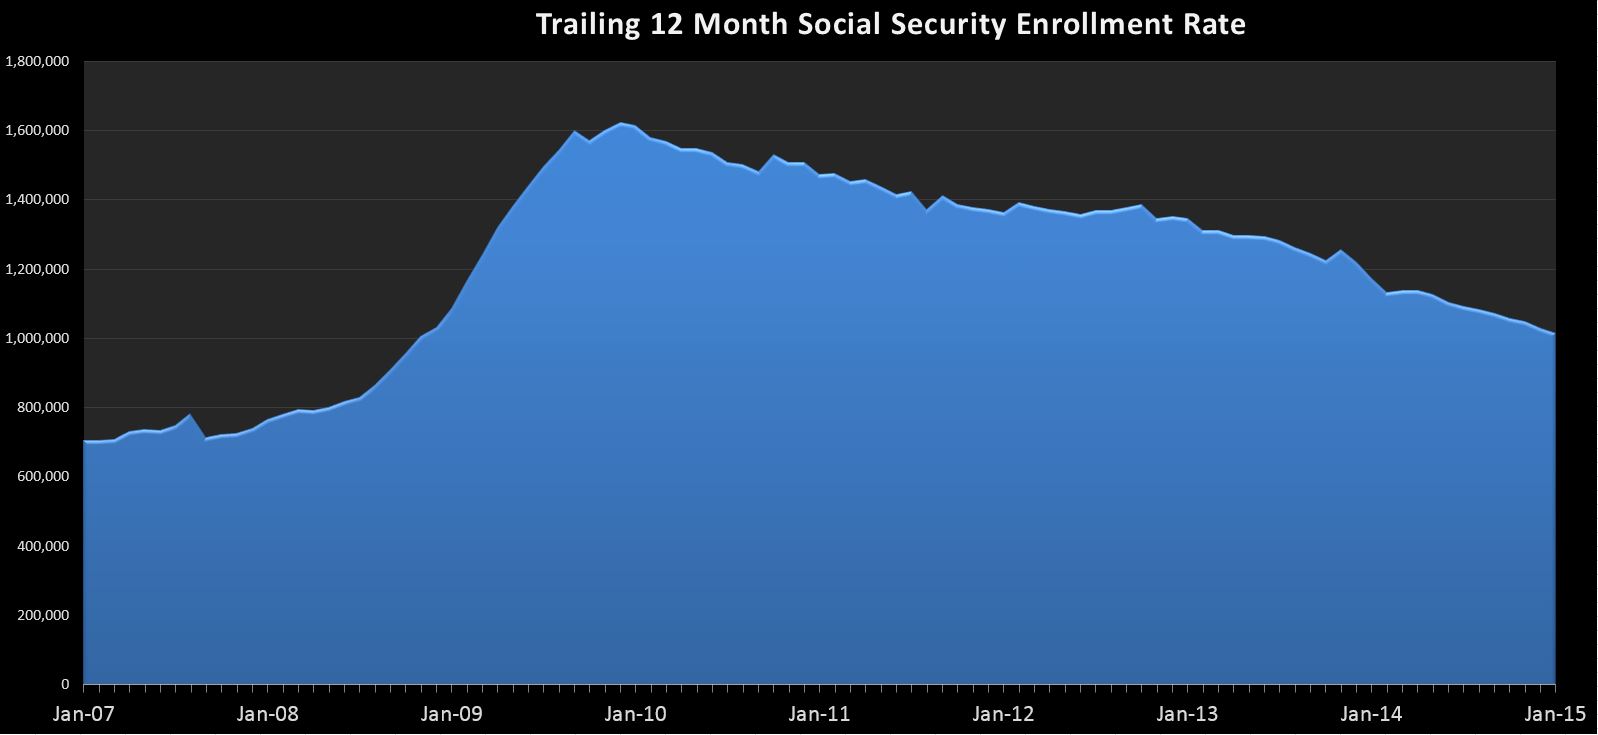
2015-02-24 SS-SS-ALLHere’s what you need to know….During the spike we saw in 2009+, most of the categories, especially disability and retired workers were growing in unison, leading to a peak growth rate of over 1.6M per year. However, since then, with the exception of retired workers, everything has more or less stabilized, including disabled workers which had been growing as much as 400k per year at one point. This leaves retired workers as the primary driver in program enrollee growth. So it’s no surprise that the trend is more or less the same…a continued decline in the annual enrolment rate that is still quite a bit higher than the historical trend.

Put it all together, and the truth is…not a whole lot to see here, and that’s a really good thing. If this chart starts to get interesting, there’s a good chance it will be because the deficit is zooming back toward $1T as revenues collapse and expenses spike higher…..just like the good ‘ol days 🙂
Debt Limit Raised…Now What?

By | Commentary

As most expected, it appears the debt limit was raised and the government has reopened…at least for now. I’m not sure how they got to these dates, but apparently the government will reopen and be funded through for 3 more months expiring 1/15/2014. The debt limit will be raised, being frozen at wherever it ends up on 2/07/2014. I’ll have a better guess at that after they true up the missing “extraordinary measures” ,  but I’m thinking it will pencil out to somewhere between a $400B-$500B increase ending up between $17.1T and $17.2T.

At that point, they will once again be able to employ EM…effectively adding $200-$300B to the debt limit. Now, I’m not sure why they chose 2/7, but if you are trying to maximize the time you get out of EM….this is about the worst date you could ever choose. The reason is that tax refunds pick up in early February and stay strong through March/April before petering out in May. So while last time we were able to hit the debt limit in mid May and squeeze an additional 5 months out of EM….this time, it might be a challenge to make it into early March. Of course, this assumes they don’t take the approach I would if I were Obama…which would be to issue about $3T of debt on 2/6, banking the cash, and making it all the way to 2016 without ever having to talk about this subject again. (not saying that’s what’s right for the country).

So…here we are, the day after a supposedly epic battle. Gotta say, not much has changed. Ok…maybe nothing has changed. I’m still not entirely sure what it was all about. At first it was about delaying Obamacare…which was never going to happen, and then, it was supposedly about balancing the budget…but the thing is, neither party really wants a balanced budget. Balancing the budget means cutting $800B of spending, which means cutting social security right here right now….which is politically impossible for either party. So either this was all about something they were never going to get, or it was about something nobody really wants….

Honestly, the end of this story has been pretty clear for a few years now. The US will default on it’s $17T (and growing) debt sooner or later, it’s just a matter of time. Furthermore, the US will default on the $100T+ of political promises…including SS, Medicare, Medicaid, Obamacare, Food Stamps ect… The math on this is extremely simple folks…it’s just a matter of time before the game is over. It is more apparent than ever that the political will to do the right thing simply does not exist within our democracy.


Fiscal 2013 US Cash Deficit: Part 2 Outlays

By | Commentary

In Part 2, we will take a look at Outlays…if you missed part 1 on revenues, you can find it here.

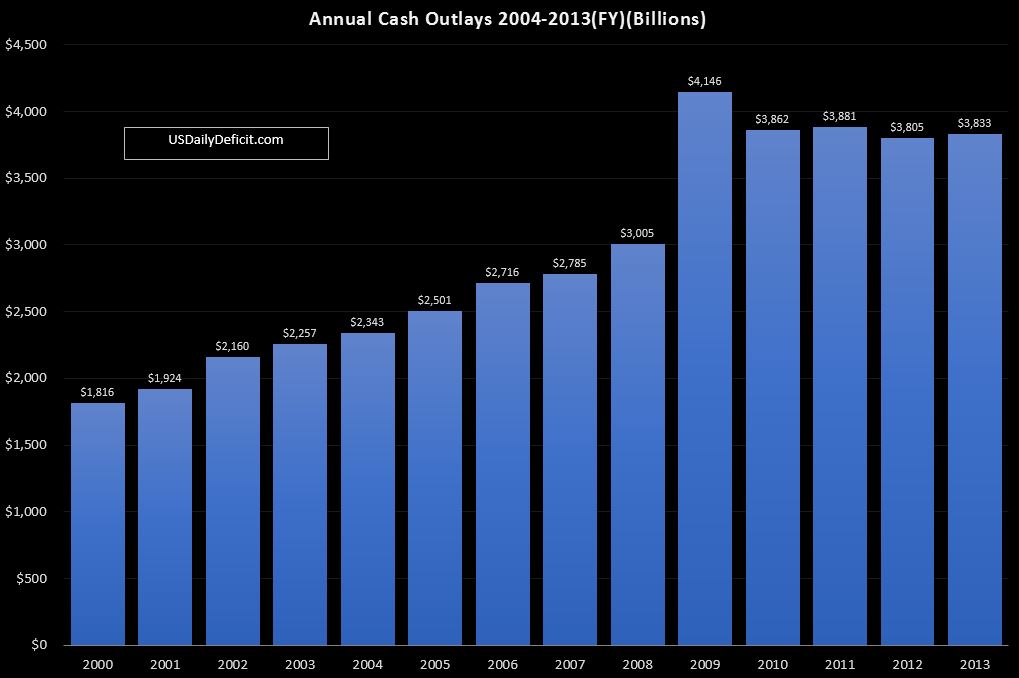
For the fiscal year, net cash outlays ended up at $3.833T, up $28B, or 0.7% from 2012’s 3.805T…so basically flat. So all of those terrible cuts the media has been reporting on all year long since the fiscal cliff and sequestration deal last year….not even enough to cut spending.

10-16-2013 Outlays Chart

The chart above shows cash outlays by year all the way back to 2000(where my data set starts)…you can see that after a spike in 2009 related to stimulus spending, we have been more or less flat for four years now.

While the chart may not be terribly exciting, the internals show a bit more movement. What we essentially have is growth in entitlements continuing unabated, but being offset by cuts elsewhere. Most of the cuts appear to have come from defense vendors, education, unemployment, and “other”. All of that is probably a good thing, but I’m not sure how much longer it can go on. Cutting the first 10% is usually pretty easy…but by the 5th year or so….finding additional cuts gets a lot tougher. Because of this….In the next year or so, perhaps tipped by Obamacare costs, we will probably start seeing outlays resume their upward slope, putting huge pressure on the deficit…especially if revenue growth pulls back from the 10%+ we’ve seen in 2013 to 5% or so….

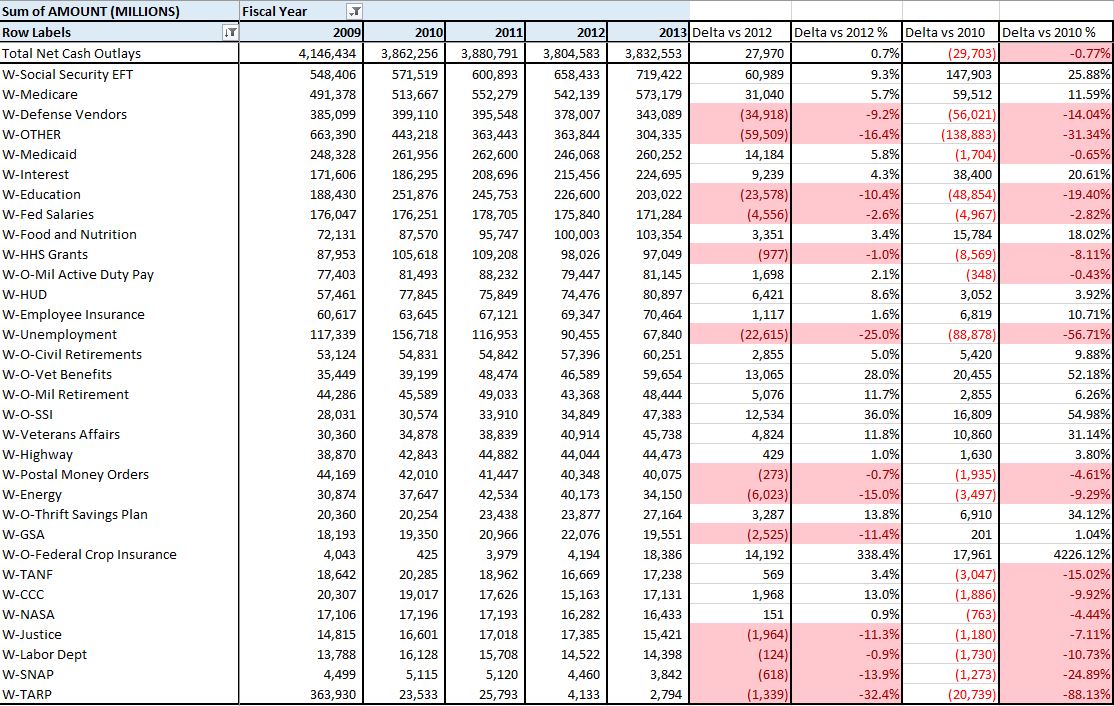
The table below gives a bit more detail on outlays by category comparing first 2013 to 2012, then 2013 to 2010…the start of this 4 year plateau.

10-16-2013 Outlays Table

At the top we have social security, which grew a scary 9.3%, or $61B. I suspect some of that growth is due to a push that accelerated the trend to electronic checks over paper checks as a cost saving measure. Paper checks ultimately get rolled up into “other” (their report…not mine), but only represent a small and shrinking % of the total. Going forward, we will probably see something closer to 5% as enrollment continues to grow at 1M+ per year.

Marching down the list, we see Medicare and Medicaid growing at 5.7-5.8%. Also interesting, Vet Benefits increased 28%, Military retirement outlays increased 11.7% and Veterans Affairs grew at 11.8%. These are all relatively small, but seeing growth rates that high in nondiscretionary categories is not a good sign for the long run.

To wrap it up….it was good news that once again outlays were more or less flat for the fourth year in a row, thanks in part to the sequestration that many, including myself, thought was unlikely to actually stand. So in that…a small victory. But the question remains…what’s next? Given the uncertainty surrounding the shutdown and the debt limit, it’s kind of hard to predict, but if we can assume that these are resolved and more or less maintain the status quo, I guess we end up next FY closer to $3.9T….perhaps higher if Obamacare costs push through to the bottom line.

In the long run….all that is going to matter is the growth of entitlements. If we can’t cut the growth of SS, Medicare, Medicaid, food stamps ect….we’re toast. Unfortunately, everyone is too scared to talk about that lest they piss off the huge senior voting block. And that’s why it won’t ever happen. Apparently, in a democracy, collapse is the only way to stop the old/rich/powerful from screwing over the young/poor/weak.


Fiscal 2013 US Cash Deficit: Part 1 Revenue

By | Commentary

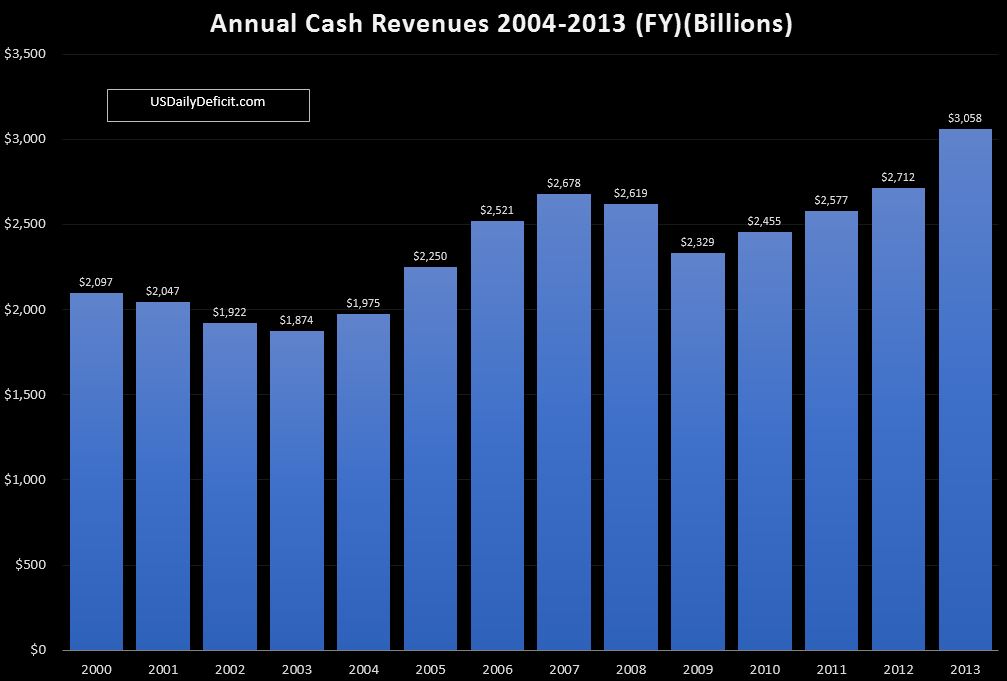
FY 2013 is now in the bank….racking up a $774B cash deficit, which is still absolutely terrible, but it does mark the fourth year in a row of improvement, and the first sub $1T deficit since 2008. This marks a $318B improvement over FY 2012 which came in at $1092B.

Revenues:

10-05 FY 2013 Revenue Chart

Revenues are pretty much the whole story of FY2013. Driven by tax increases that went into effect in January 1, 2013 and the tax avoidance behavior that preceded it, revenues were up an impressive $346B (13%) for the full FY. Corporate taxes were up $30B (11%), taxes withheld from paychecks were up $201B (11%) and taxes not withheld were up $83B(24%). These results are about $160B higher than I was predicting back in February, so there is no denying it…raising taxes raises revenues…at least in Y1. Of course…$60B of that miss was due to the Fannie Mae payday loan, but a miss is a miss.

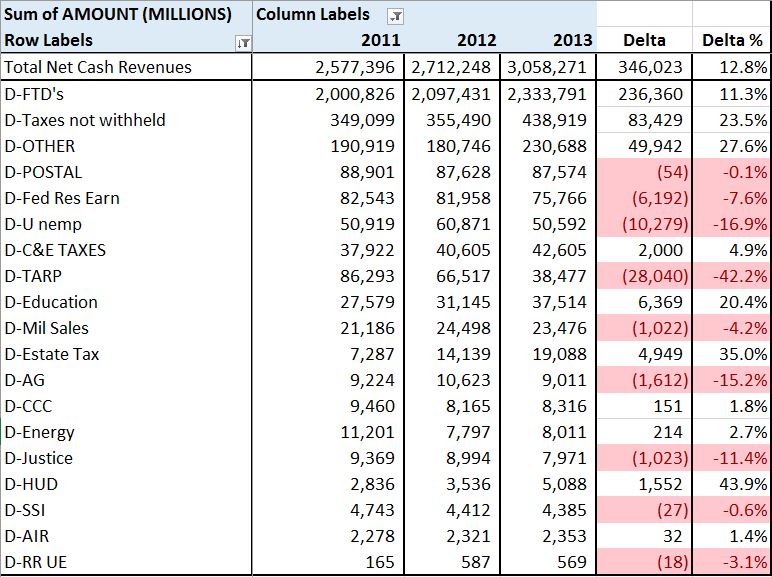
Below is a further breakdown of revenues by source(note**they don’t add up because tax refunds offset revenue, but are not included in the table; Deltas compare 2013 to 2012):

10-05 FY 2013 Revenue Table

All of our major categories have healthy gains, though “Other” includes the $60B from Fannie Mae. Deposits from the states related to unemployment insurance were down 17%…I would guess that the rates were lowered. Deposits from TARP reimbursements were also down big….a trend that will continue as they have pretty much slowed to a trickle in recent months.

I think even a pessimist such as myself has to be impressed by the YOY revenue gains we have seen in 2013, and will  likely continue to see through December. The big question in my mind though is what will happen in calendar year 2014. Imagine a steady state country with $1T of annual revenues in Y1. Then, say they decide to raise taxes across the board 10%. It should not be a shock to anyone if at the end of Y2, revenues have grown 10% to $1.1T. But what to expect for Y3? All else equal, we will likely come in right about $1.1T again. Taxes were only raised once, lifting revenues up to a new steady state. Without a second round of new taxes, we have no rational reason to expect another 10% revenue growth right??

And yet…that is more or less what the CBO is projecting for the next 2 years….continued high growth of revenues. I’ve yet to make a FY 2014 forecast, but I’m thinking right now that 5-6% growth for 2014-2015 would be pretty optimistic. If they stick with 10%….we are going to end up pretty far apart. This is the big unknown at this point. If come April 2014, revenues are only marginally up….it is going to be abundantly clear to all that there is no chance of ever “growing out” of this problem. If, on the other hand…2014 does see 10%+ gains for the second year in a row….even I would have to see at least a glimmer of hope 🙂

Stay Tuned for Part 2…Outlays


The Debt Limit Will Be Raised

By | Commentary

The news of the day is that Treasury Secretary Lew has announced 10/17 as his latest greatest estimate of when we will “for real” become unable to cover outlays with incoming cash. Remember….hitting the debt limit isn’t the problem(that happened back in May and was a completely voluntary event)…running out of cash to pay bills is the problem.

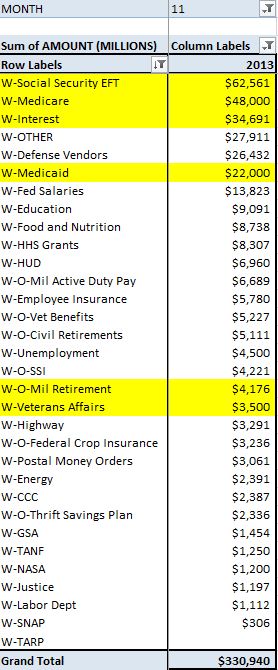
Looking at a partial month is problematic, so for simplicity, let’s just assume we run out of cash at the end of October. What would November look like?

Over the full month, per my current forecast, November should see about $202B of cash revenues, offset by about $331B of outlays, good for a $129B deficit. But the good news is….we can still pay for $202B of those expenditures. But how to decide what to pay…and what not to pay?(Normally…they would issue $129B of debt in exchange for cash…that will cease to be possible) That is the problem. $35B or so of interest is due…probably want to pay that. Rolling expiring debt isn’t a problem…..If I pay off $1B of expiring notes….then replace it with a new $1B issue…debt outstanding remains constant. Not paying Social Security, Medicaid or Medicare would save $133B, which is enough, but that probably wouldn’t end well. Active duty military pay??? Nope. below is my forecasted outlays….what would you cut?

09-20-2013 November 2013 Expenditures

And this is the dilemma our poor…poor politicians find themselves in…both Republicans and Democrats. The government spends about $3.8T per year, but only manages to bring in $3.0T of revenues. The plug is debt…..$800B. So now here we are….right at the debt limit. If it isn’t raised, all else equal…..we have to cut $800B of spending. But unfortunately…all else is not equal. If you cut $800B of spending….by definition that cuts GDP by $800B directly, and who knows how much indirectly. This in turn, cuts revenues, which cuts spending….it’s either a terrible or wonderful circle, depending on who you are. Just for reference $800B is equal to about 16M 50k per year jobs….perhaps 8M (or less)government jobs I suppose 🙂

That’s what it would take to balance the budget. Is that what you really want? Look folks…it’s simply not politically possible….therefore it will not be done. Oh sure….they may reach the limit for a few days or even a week….maybe “slow paying” some bills (trust me…the checks in the mail) but not for long and I doubt it even gets that far. The debt limit will be raised…not because it’s the right thing to do…but because it is the easiest thing to do.

Don’t get me wrong…I’m not endorsing this….it’s not what I think should happen, rather, it’s what I think will happen. Honestly, it’s almost certainly too late….this cycle will continue until it collapses on itself and all of this debt (on and off balance sheet) is simply defaulted on, probably by inflating it away.

Not that anyone has asked, but my solution would be over say a 10 year period (wish we could have started 10 years ago)  simply cut all non-essential and unconstitutional expenditures (including social security, Medicaid and medicare) 10% per year until they are zero….reducing taxes along the way. I would also default immediately on all $16.7T of debt outstanding….if you were dumb enough to lend money to Uncle Sam…..aka our congress with a single digit approval rating…. well…you deserve to lose your $16.7T.

Finally, when it was all said and done I would cut taxes to put them in line with the new expenditure requirements…probably somewhere between $500B and $1T per year. Yes…there are a lot of details to work out, and it would never actually happen, but the short term pain would be made up by long term prosperity…which is why it will never happen….it’s been a long time since anybody told the American people no, and I see no indication anybody is going to start now. The majority has found it’s way into the nation’s pocket book demanding pensions, schools, food stamps and infinite government paid medical care far beyond the nation’s willingness, or even ability to pay. No…there is no political solution here…the game will continue until it all crashes and burns. That day will come soon enough, but I doubt it is 10/17/2013.

Stay tuned….we look to be in for an interesting month.