Tag

US debt

3/11/2013 Daily US Cash Deficit

By | Daily Deficit
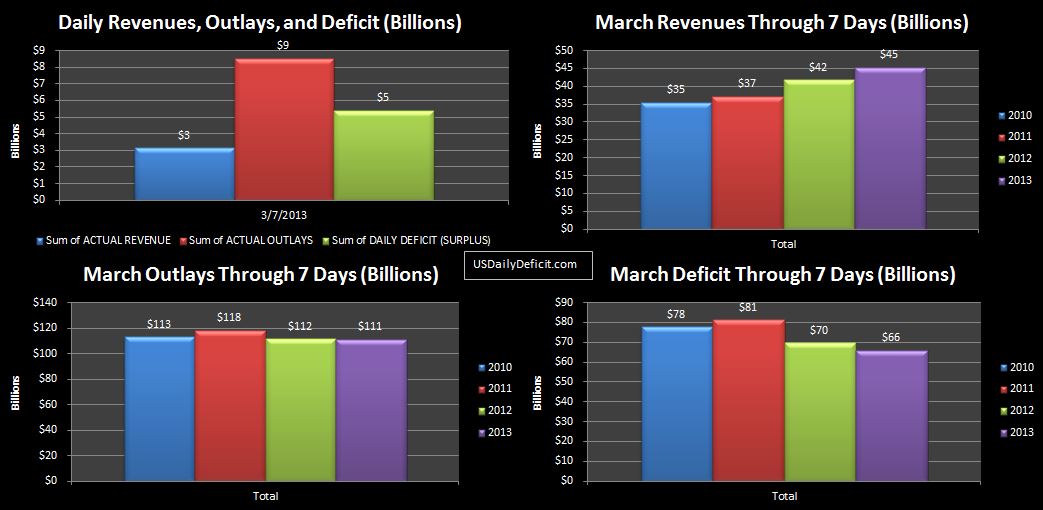
The US Cash Surplus for 3/11/2013 was $3.2B on strong Monday revenues. The March 2013 deficit through 11 days is $66B, starting to show some divergence from 2012, but I suspect this will go away tomorrow when the 2012  GSE MBS Purchase Program Income discussed yesterday shows up in 2012, but not in 2013. (unless it does!!)

2013-03-11 USDD

It is also worth noting that 2010 and 2011 had two additional business days over 2012/2013 through 11 days, and already had their 2nd round of SS payments go out. March 2013 refunds are running $5B over last year…not a huge variance yet, but possible evidence that they are catching up on processing refunds.

3/07/2013 Daily US Cash Deficit

By | Daily Deficit
The US Cash Deficit for 3/7/2013 was $5.4B bringing the monthly total to $66B through 7 days, pretty much in line with last March. Things should start to get a bit more interesting next week as we have Social Security payments, Corporate income taxes, and of course…Spring Break!!…which means traffic for those us us who have to work (or are fortunate enough to have work) is going to be great!! Also, I’m sure there will be a lot of news stories about stupid college kids doing stupid things, so if you get tired of reading about the deficit and the sequester, you’ll probably have some options 🙂

2013-03-07 USDD

US February 2013 Cash Deficit Review: Part 2

By | Commentary
And now for the stunning conclusion part 2…part 1 is here if you missed it.

Outlays:

Outlays for 2/2013 ended up at $324B, down $5B from last February’s $329B of outlays…that’s 1.49% if you don’t have a calculator handy. Small, but lets give credit where credit is due. Yet…there’s nothing terribly surprising about this…for a couple of years now, we have seen relatively flat spending as increases driven by the ever growing entitlement programs are mostly offset by decreases in other areas. The spreadsheet below shows the 32 categories for outlays I track, with 2012 vs 2013 YOY and YOY% on the far right columns

022013 Outlays by Type

Right at the top we see that payments to defense vendors and the education department are down by a combined 6.5B…pre sequester, and “Other” is down an additional $4.5B. Social Security, Medicaid, and Medicare combine for a $6.8B increase, with unemployment payments down $2.7B…which is in line with the trend we have seen over the last year.
One quick note on the federal crop insurance line that went from zero to $1.9B… The DTS is not terribly consistant about reporting “Other” expenses unless there is a large outlay on a particular day. Because of this, I catch what I can, but some of it inevitably falls into my “other” category. In total, we get to the correct total outlays figure, but some of the smaller categories don’t necessarily have the most accurate data. In this case, it is likely that there were at least some outlays in February 2012, but none ended up being large enough to make it onto the DTS. Bottom line with Outlays…it’s great we saw a decrease, but this is nowhere near being a material shift…it will be interesting to see what, if any effect the sequester has over the next few months.
Daily Deficit for 3/4: Although I couldn’t help myself on the 3/1 charts, I’m going to wait another couple days before I resume the YOY charts. If you just have to know, 3/4/2013 ran a $5B surplus on strong Monday revenues. I will wrap up the February review tomorrow with a look at debt

Govt spends $80B on Sequestration Day 1

By | Daily Deficit
I know that I said yesterday I wasn’t going to publish the daily deficit for 3/1, but I changed my mind because I think it illustrates the absurdity of the deficit/debt debates we’ve been having for the last few years. The US Daily Cash Deficit for 3/1/2013 was $53.5B…in one friggin day!! The tax increases on the wealthy democrats have been wanting for a decade and finally passed last year bring in a meager $60B per year…as estimated by the CBO…which almost certainly means the numbers are bogus, and it will probably turn out to be $20-$30B in reality. The dreaded sequester…which will hollow out our economy, leave millions homeless and our borders suseptable to Viking Invaders…a mere $85B. So if we can blow through…in one single day almost the same amount we are discussing “cutting” or “taxing” in an entire year, maybe, just maybe, we are not quite grasping the reality of the situation.
I imagine a financial planner sitting down with a couple making $50k a year, but spending $200k. The planner says…you know, this isn’t sustainable, you guys need to cut back. So the wife…sipping a $200 bottle of wine says..you know…I guess we could cut back on the wine a bit. The planner looks at her incredulously…”Lady…I don’t think you understand. You are going to lose your house, your cars…you can forget about wine…you need to start applying for government housing because you are going to be living in a cardboard box in about a week.” That’s the reality of our situation. Uncle Sam is broke as hell and functionally bankrupt. Without the ability to print money and essentially sell ourselves our own debt via our buddies at the federal reserve and playing games with the “trust fund” we would have “for real” bankrupt years ago.
So here it is…On the first day of the sequester…$75B of spending ($80B if you include refunds) out the door. Raise your hand if you think this will end well.

2013-03-01 USDD

US February 2013 Cash Deficit Review: Part 1

By | Daily Deficit
Another month has come and gone. We are all now 28 days closer to death….whenever that will be. We are 28 days closer to the day our star, the sun, runs out of hydrogen, begins it’s transition to a red giant, and ultimately cooks the earth into crunchy black char ball before destroying it altogether. And… perhaps even more ominously… we are 28 days closer to the day the US government begins defaulting on its on and off balance sheet liabilities. For all of these certain future events, we can’t predict  the exact date they will occur….but we do know with absolute precision that we are one month closer to the day of reckoning than we were a month ago.
DEFICIT:
But enough gloom and doom, let’s crunch the numbers and see what happened in February and what it means for the big picture. As we have discussed in prior posts, February is almost always the worst month of the year for deficits, even back in the good ol’ days like 2000 when we kinda sorta actually had an annual surplus…depending on what kind of accounting you used (shady vs. shadier??) So we came in at $229B…a bit under last year, but right in line with the last 5 years. Clearly what little improvement we have is immaterial…a mere 8% improvement, and there is a good chance most of that is related to delayed tax refunds.
022013 Deficit vs py
REVENUE:
The biggest deficit related news in the last few months may have been the President’s tax hikes…namely about $60B per year on the wealthy…and about $120B per year on those of us who pay payroll tax. So let’s take a look at revenues by category with this screenshot from excel. You may recall that 2/2013 revenue was $95B vs. $80B last year. I need to clarify that this is “net” revenues….We take all revenues from the sources listed below, then subtract tax refunds to get net revenues. Since February is especially heavy in refunds, the net is always much lower than other months, but we apply it consistently, and I am much more comfortable with this accounting approach.

022013 Revenues by Source

 In yellow I have highlighted some of the more interesting sources of revenue. Federal reserve earnings are down almost $3B…this is a bit odd and I will definitely be keeping an eye on this. Federal reserve “earnings” primarily consist of them printing money, and using it to lend money to the federal government by purchasing bonds. Then, the treasury sends the Federal reserve interest payments…and the federal reserve turns around and sends that…less their costs…back to the treasury? Sounds kind of shady huh? You bet your a** it is. Moving on “FTD’s” (nope..it’s not what you are thinking)…Federal Tax Deposits is the governments primary revenue stream….made up mostly of  taxes (income and payroll) withheld from your paycheck and sent in to Uncle Sam. They are up, but only $7.5B…we’re expecting ~$15B per year thanks to the recent tax hikes. It could just be the extra day in February 2012, but I’m not entirely convinced this is the case.
Next we see that “Other” deposits….are down $7B, but that deposits from TARP are up almost 500%. You may recall Tarp from years ago…where our government lent hundreds of billions of dollars of public money to all their donors, buddies ect… at below market rates. As those loans are repaid…and a good chunk of them were…the money comes back in as revenue. It’s not perfect, but as an Uncertified Public Accountant, it still gets my stamp of approval. For more information on this, take a look at “We Won’t Miss TARP, But Uncle Sam Will”. Finally, we get to the big number…Individual Tax refunds were down year over year by $15B, presumably because of the tax filing being pushed back a week or two and subsequent processing delays. If we back this out, then what we have for the month is a small increase in FTD’s offset by small decreases elsewhere for flat YOY revenue…despite tax increases….that’s not a good sign, but one month does not make a trend…lets see how March turns out before we turn on the recession alarms..ok maybe April.
Ok guys…this is getting long, so i’m going to split it in half and do the spending and debt analysis tomorrow. If you were wondering about the 3/1 daily deficit…it was a whopping $53.5B….I’m going to hold off a day or two for the charts because the timing is making the year on year charts go nuts so it doesn’t really make sense yet.