Tag

US Debt Limit

Explaining April 2013’s Revenue “Surge”

By | Commentary
I’ve been digging into the April “Surge” in revenues, and while unfortunately we won’t know if I am right until next April, here is my working thesis….
I probably said it a dozen times during April….the surge was primarily in the category “Tax deposits not withheld”, and this is likely the key to understanding what happened. I don’t have the numbers in front of me to prove this, but I think it is a pretty safe assumption that most of these tax deposits are made by the wealthy…let’s say top 5%. Most of the population…myself included, pay almost all our taxes through payroll withholding. Throughout the year, using IRS tables and information provided by the employee, a certain amount is withheld by the employer for FICA and income taxes. Then, after the year end, you plug your actuals into turbo tax, and probably get a refund of a few thousand bucks. These fall into “taxes withheld”…obviously because they are withheld by your employer and remitted to Uncle Sam on your behalf.
Taxes not withheld are a completely different animal. Say you own a small business, or daytrade, or own some timberland. You don’t have an employer to withhold your taxes….in fact, depending on your quarter, maybe you have a ton of income, or no income at all. So…your accountant will instead, about every quarter take a look at your books, and send enough $ to Uncle Sam to keep him off of your back until the next quarter. In one quarter, maybe you sell $1M of timber that took 30 years to grow….your accountant better send in a few hundred thousand. Unless…that is you had some day trades go bad, and also lost $500k.
So  back to my hypothesis. There was a lot of speculation running up to the end of 2012 that people would be making a lot of year end tax moves to shift income into 2012 before tax rates went up in 2013. There are a lot of ways to do this, but the simplest one looks to me like the capital gains tax…which went from 15% to 23.8% (includes a new medicare surcharge of 3.8%) for those making over $400k per year.
So imagine you fall into this category, and had purchased a lot of stocks near the bottoms in 2009. It is near the end of 2012, and those gains of ~100% or so are sitting on your books…untaxed. Taxes are going to jump from 15% to 23.8% in a few days…what do you do? Simple….you sell them all…take your 15% lump….realizing that’s the best it’s probably ever going to get, and it could very well get a lot worse from here… You set aside enough to pay your taxes…then the very next day, if you are so inclined, you buy them all back.
Thus….you recognize all of your gains to date in 2012 at the 15% rate, and establish a new basis in your stocks at much higher 2012 prices. Then, as April 2013 rolls around, your accountant sends a very large check to Uncle Sam, who books it as Tax Deposits not withheld. YOY, we saw this category increase by about $56B…let’s divide that by the rate-15%, and we can see that perhaps as much as $375B of capital gains were taken in Q4-2012 to take advantage of the expiring 15% rates.
Obviously, this resulted in a blowout month.. good for us.. (bad for my forecasting record) But, if this is indeed what happened, we should then be extremely cautious about working this one month anomaly into our 10 year forecast because not only will it not repeat itself, we could actually witness a decline in revenues next year (April)…not cool if you were expecting exponential growth in the 11-12% range like the CBO.
So for now, it’s just a matter of sitting back and watching the daily numbers roll in. June and September are the next two months with material “not withheld” revenues…each should be in the $60B range, compared to April’s $196B. What we are looking for is YOY growth. 10-15% or so would be more or less in line with a surging stock market and higher tax rates. Anything close to the 40% YOY growth we saw in April would send me back to the drawing board, and possibly making some large revisions to my own 10 year forecast.

March 2013 Debt Update

By | Commentary
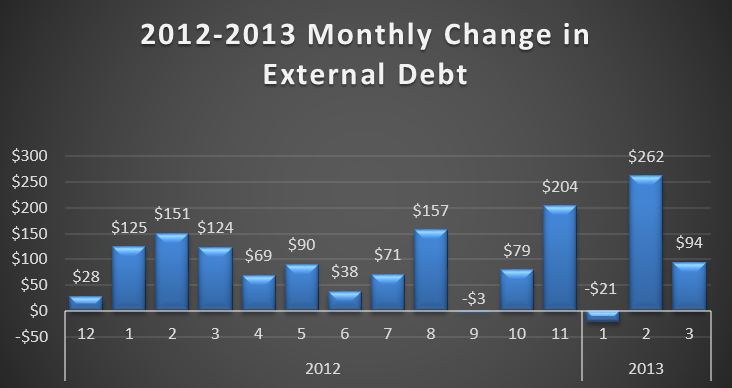
Over the course of March 2013, total debt outstanding increased $84B up from $16.687T to $16.771T. External debt…the only category that really matters was up $94B, but offset by a $10B decrease in the intragovernmental debt category….basically money we are pretending we loaned to ourselves, rather than admitting we already blew it.

2013-04-02 Monthly Debt Change

Moving on, the TTM (Trailing Twelve Month) change in debt:

2013-04-02 TTM Debt Change

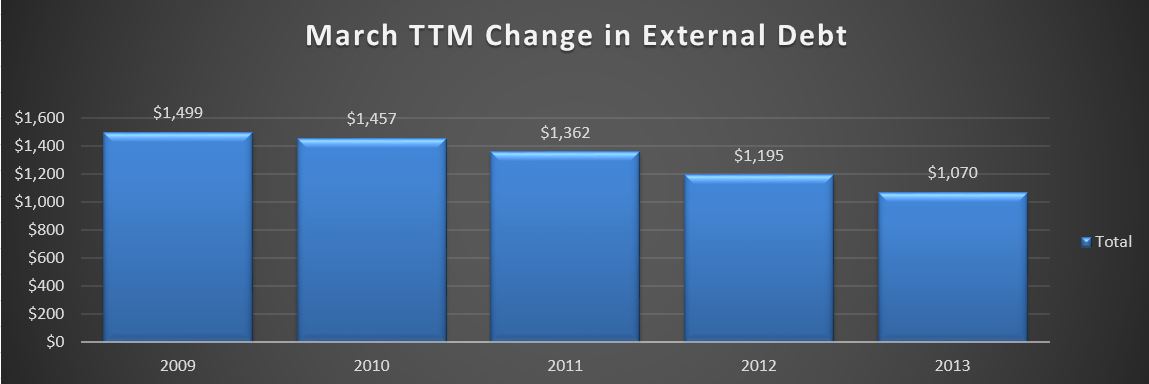
This looks at the TTM change in external debt only for March of 2009-2013. For example, the 2013 amount of $1.070T is the difference between 3/31/2013 and 3/31/2012. …how much debt have we added over the last 12 months. I like TTM when looking at the debt and deficit because there is so much seasonal variation that looking at any one month doesn’t really tell you anything…like this month, April, will likely post a monthly surplus….but that doesn’t really tell you anything about the $1T or so annual deficit.
Looking at the chart (made in Excel 2013…not crazy about the grayish black fade), we can see a $125B improvement…the right direction no doubt, but at a tepid and declining pace…for now. At this pace…we would get to zero in 8.5 years…assuming the pace continued…it will not. What we will likely see is an acceleration through the remainder of the year thanks to the recent tax increases and relatively flat spending. Then, after a year or two of stabilization, it is going to turn the other way as the growth in outlays surpasses any revenue growth, driven primarily by the large welfare programs…Social Security, Medicare, and Medicaid.
Yes…I said it….these are all straight up welfare programs where one large voting block has forced a “generational contract” where the old and wealthy steal from the young and poor. This is justified by..” well, we were screwed too, so now we are gonna get ours.” Maybe so…but it’s not gonna work for much longer. This entire system needs to be abandoned and go back to the old way. Either you save enough on your own in your 40+ year career to sustain the retirement you want…or, your kids/extended family supports you…if they like you.. The end. The average person making $50k puts about $7,500 each year into the social security/medicare pot each year…. What could you do with $7500 per year? Probably pay off your house in 10 or 15 years and start amassing a lifetime supply of benefiber…. Ain’t retirement grand?

3/26/2013 Daily US Cash Deficit

By | Commentary
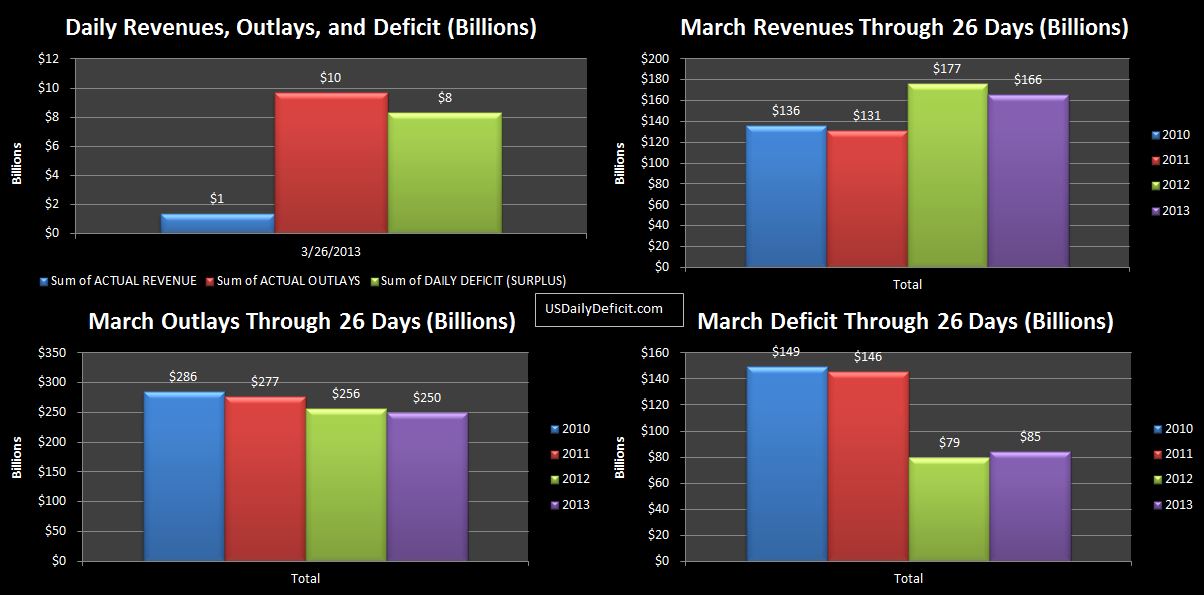
The US Daily Cash Deficit for 3/26/2013 was $8.3B, bringing the March deficit through 26 days to $85B. With 3 business days remaining, it looks like we are zeroing in on $105B or so, with the possibility of a $+15B surprise depending on how Medicare costs flow in.

2013-03-26 USDD

Do You Believe In Fairy Tales?

By | Commentary, Quantum Economics
It Seems that for the first time in four years, the senate has passed a budget. Republicans are bleating that it “has zero real deficit reduction” and “never balances.”…which is probably all true, but as I discussed a few weeks back, neither does Paul Ryan’s Path to Prosperity. You see, any monkey with a free copy of Google Spreadsheets can make a lot of bogus assumptions about revenue growth and cost cutting and squeeze the “projected” deficit down to zero in 10 or 20 years…Just ask the Congressional Budget Office, who in 2000 projected to much acclaim that the US would be more or less debt free by 2010.
In any case, we now have affirmation by both political parties that one of three things is true about each of them.
  1. They are a bunch of Lying SOB’s…
  2. They aren’t lying, they are just incredibly incompetent.
  3. Or…they believe in fairy tales.
I really don’t know which it is…all seem feasible to me. However, it is time for you to decide if you believe in Fairy Tales…or not. The fairy tale they want you to believe…written by the economic high priests of the last century is quite simple. First…deficits don’t matter. Government, led by the infinite wisdom of elected politicians and an army of bureaucrats can borrow and print an infinite amount of money with no consequences. They will save your job, care for you when you are sick, educate your children, and even manage your retirement for you…all you have to do is believe….and maybe tap your shoes together 3 times.
For comparison, let’s think about what might make sense for a typical family budget. It is generally accepted that an ideal state is a surplus…you should be saving, let’s just say 10% of income…. for rainy days, paydown of debt, and hopefully accumulation of enough wealth for the rather modern invention we call “retirement.” We could have a debate over the specifics, I think we can all agree that more or less, this is a pretty good prescription for success.
Imagine if instead of following the above, our family, with a household income of $80k/year, decides to take the prescription advised by modern economic theory. At this point in time, our family, has accumulated debt approaching $500k….not mortgage debt…unsecured credit card debt. Further, they are accumulating debt at the rate of about $40k per year, with no realistic plan to address the annual deficit, much less actually pay down debt accumulated so far. At this point,  really should be bankrupt, but fortunately for them, their credit card company keeps increasing their credit limit, and at this point has actually removed the limit altogether.
Do you see this ending well? Is it possible that a financial policy that would so obviously asinine for a household makes sense for a nation? Ben Bernanke, Tim Geithner, Republicans, Democrats, and most modern economic theory thinks it will. That’s what’s in the Fairy Tale, so it must be true…right? You need to decide for yourself what you believe. Is infinite deficit spending the right medicine to heal a sick economy, or is it just another line of cocaine….inching closer to bankruptcy and ultimately…death?
 

3/20/2013 Daily US Cash Deficit

By | Commentary
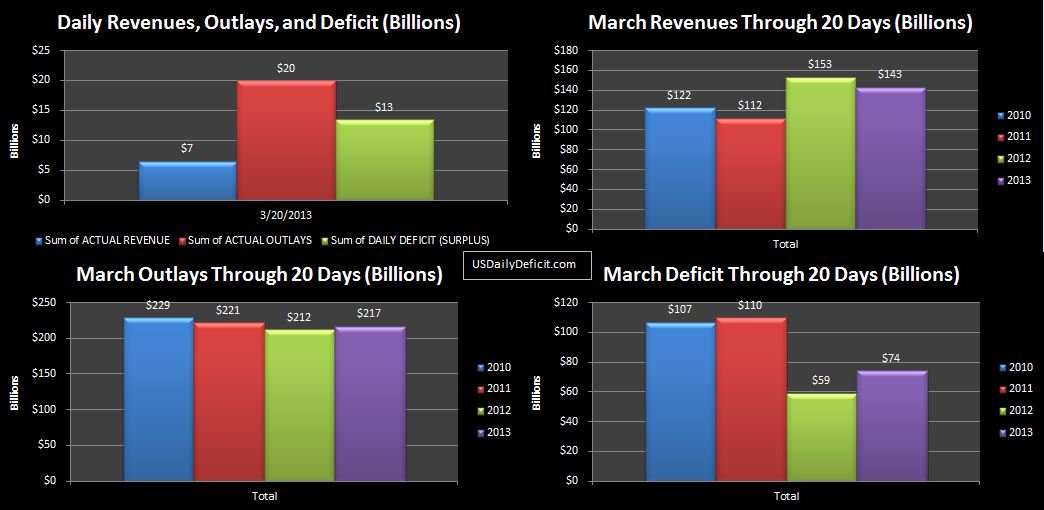
The US Daily Cash Deficit for 3/20/2013 was $13.4B driven by the third round of Social Security payments and $6B of tax refunds.. Through 20 days, the March 2013 deficit stands at $74B..$15B worse than March 2012 at this point, though about half of that is likely some Social Security timing. More or less, the two months are quite similar, with outlays fairly flat, and revenue gains related to tax hikes being offset be revenue losses elsewhere and higher tax refunds…which we account for (correctly) as negative revenue. With seven business days left, I don’t expect any large surprises… 3/2013 looks to be on track for a deficit in the ballpark of last years $139B…less $15-$30B of outlay timing that will likely go out 4/1 instead of 3/30 like  in 2012 due to the way the weekend falls.

2013-03-20 USDD

It’s a bit early to begin dreaming about April, but let’s take a quick glance anyway. April is usually the shining star of the year, aided by everybody’s favorite holiday…Tax Day!! All of those poor fools who decided not to give Uncle Sam an interest free loan by over witholding trudge down to the post office, lick a crusty 5 year old forever stamp, and grudgingly drop a big, hopefully not hot, check in the mail for good old Uncle Sam. Because of this, April sees about $130B of additional revenue, and is generally the “least worst” month of the year. Last April posted a Surplus of $59B, breaking a 43 month streak of deficits going back to 2008. That sounds like a good initial estimate….Assuming revenues continue to outpace 2012 by ~10%, this will likely be more or less offset by increased outlays related to the same March timing issues discussed above. The wildcard is going to be that $15B Medicaid payment, and the potential for even larger than 10% increases in revenue. I don’t know how this will play out, but there were reports that perhaps $100+B of income was shifted into 2012 primarily by corporations and high net worth individuals. (anybody remember all those “special” dividends”?) 4/15 would be the last chance to pay those for individuals…so maybe we’ll see a 15-20B pop?? I wouldn’t count on it, but  it’s just another wildcard out there.