Tag

Social Security

January 2015 Update: Social Security Enrollment

By | Commentary

It’s been 7 months since my last SS update, so first a quick refresher. SS is a broad program best known for the retired worker program…..where you pay in a portion of your paycheck each week, and in return, will hopefully get a monthly check once you reach~65….for the rest of your life. As of January, there were 39.1M retirees collecting an average of $1,331 per month, which pencils out to $52B per month, or $625B per year. This population is growing at about 1.1M per year…that is new retirees less deaths of existing enrollees = 1.1M per year.

Moving on…the second largest piece of SS is Disabled Workers, with 8.9M people receiving an average of $1,165 per month. The balance is about 10 smaller categories of children, spouses, widows etc…. of retirees and disabled workers. Each month, the government releases a report here that details the new monthly totals, their average monthly benefit, and even the Male/Female split if that interests you.

Any one report isn’t all that useful, but by compiling them and tracking the monthly and annual changes, one can squeeze some useful, or at least interesting data out of them. I track them for two primary reasons. First, SS is a huge part of the cash deficit, …$773B over the last 12 months ending in January, good for 20% of cash outlays, and growing at 5% per year. Supposedly, at some  point over the next 5 years, we should start hitting the meat of the Baby Boomers, resulting in a notable increase in enrollment and cost….I want to see it in real time.

Second, as you will see in the charts below, there is a noticeable correlation between the state of the economy and the SS enrollment rate. In the “Great Recession”, we saw enrollment rates more than double from 2007 to 2009. Again, this series gives us a real time window into the decisions millions are making…. It may or may not be a leading indicator, but it is certainly worth watching because if we have another spike, whether from the boomers retiring or a recession, it will have a noticeable affect on the deficit.

First up…just the retired workers chart:

2015-02-24 SS-Retired Workers

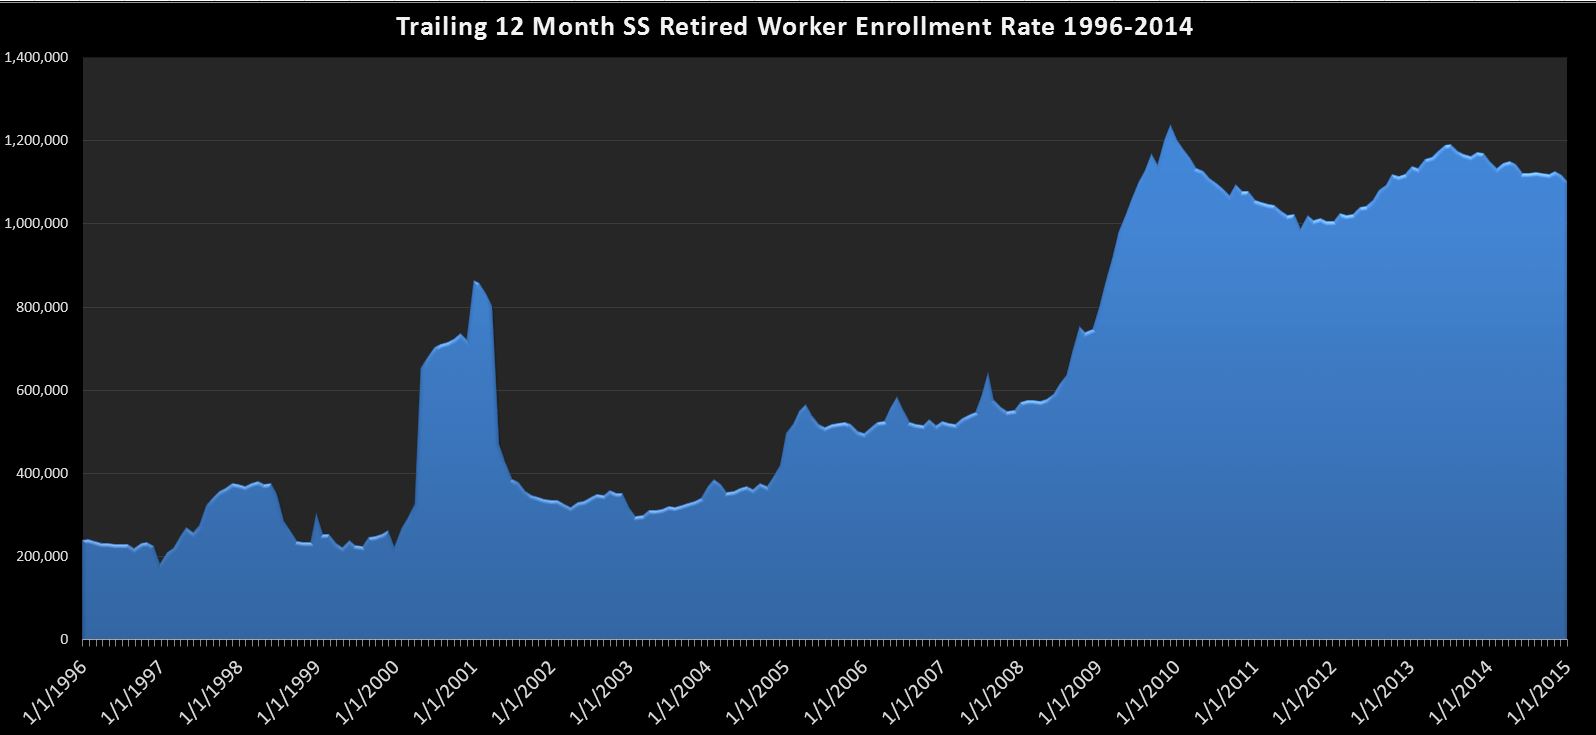
Here we can see the relationship between the economy and the rate of SS enrollment with a spike in the 2000-2002 time frame and again in 2008. Since then, it has remained elevated, but is slowly trending down over the last ~1.5 years. It’s still pretty bad…at over 1.1M per year, but really no material change since my last report, so i guess that’s a good thing. If…or when we see this swing back around and start heading toward 1.5M….you can be sure trouble’s a’brewin.

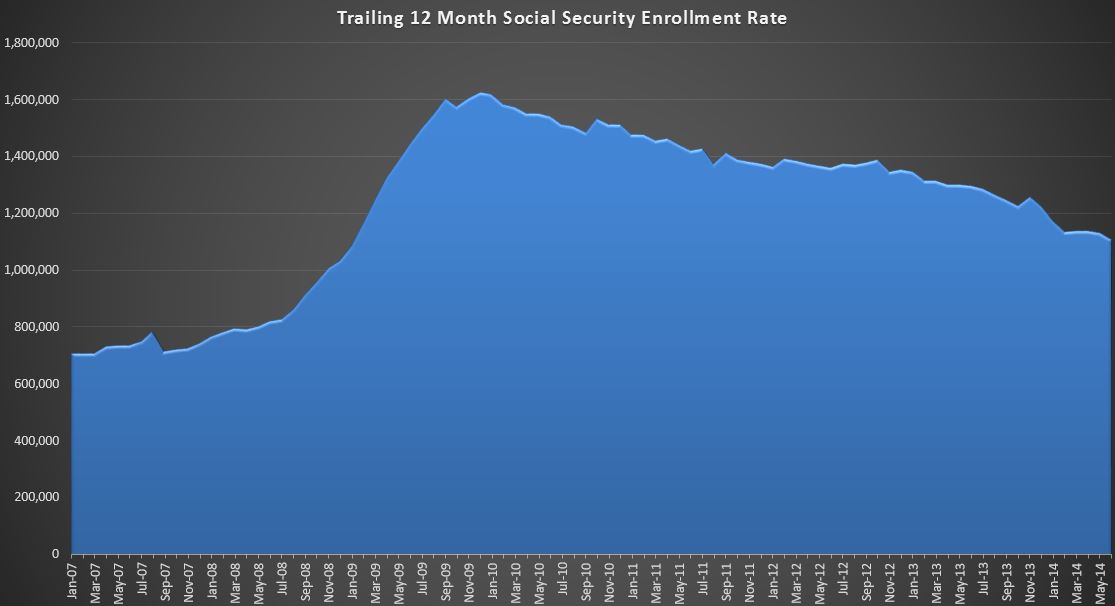
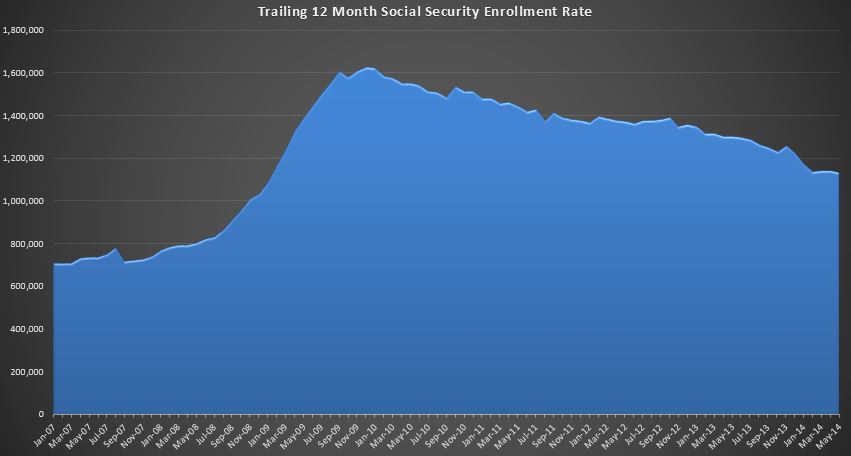
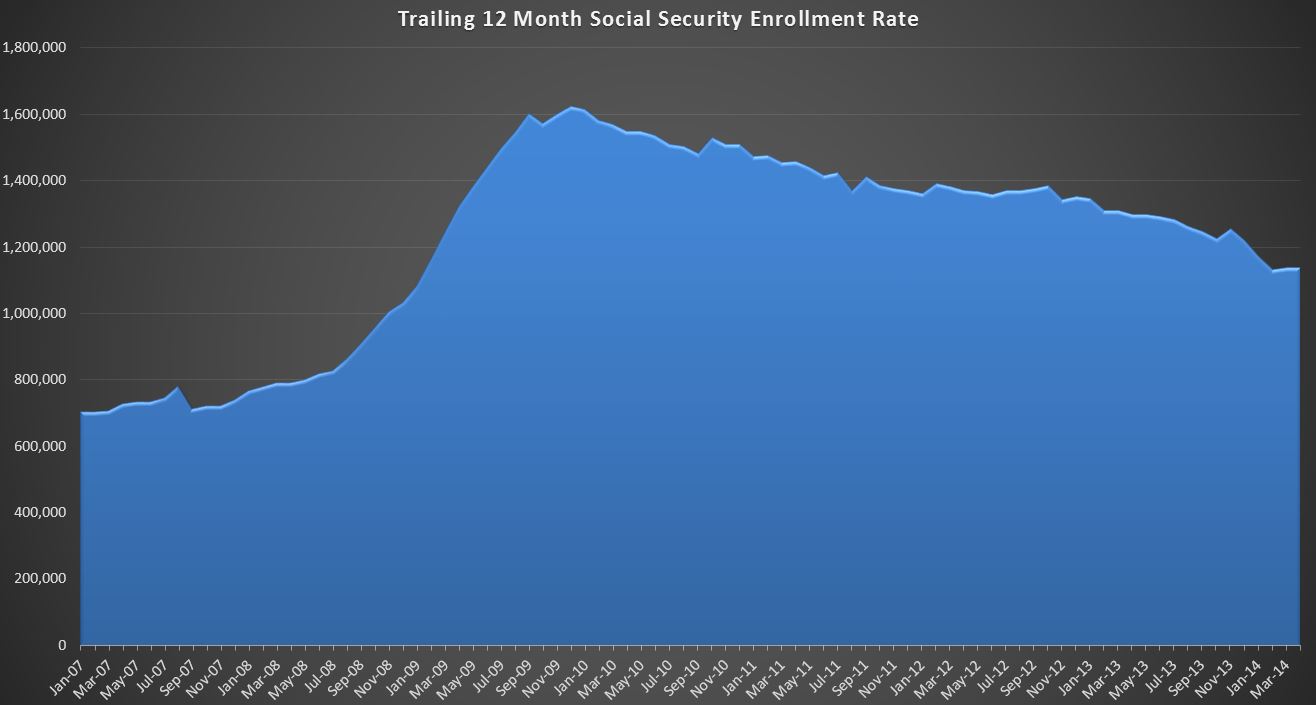
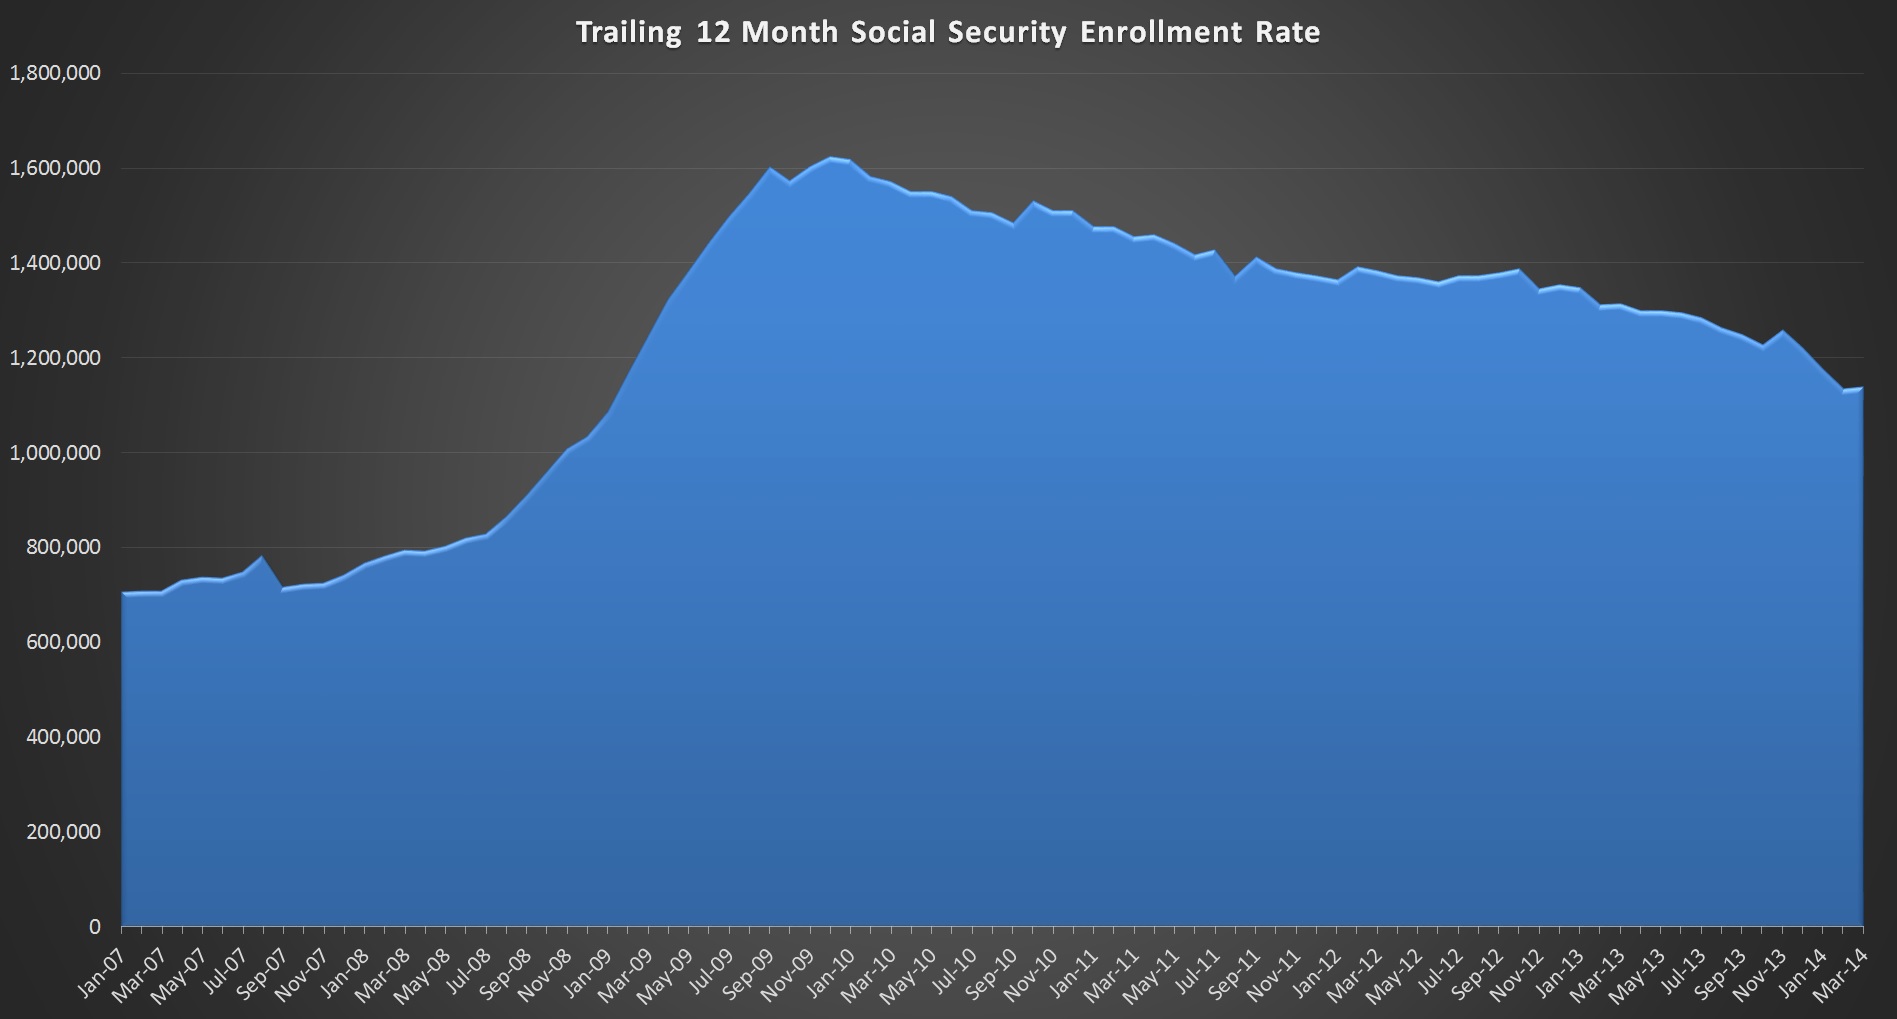
Next, we look at the whole program:

2015-02-24 SS-SS-ALL
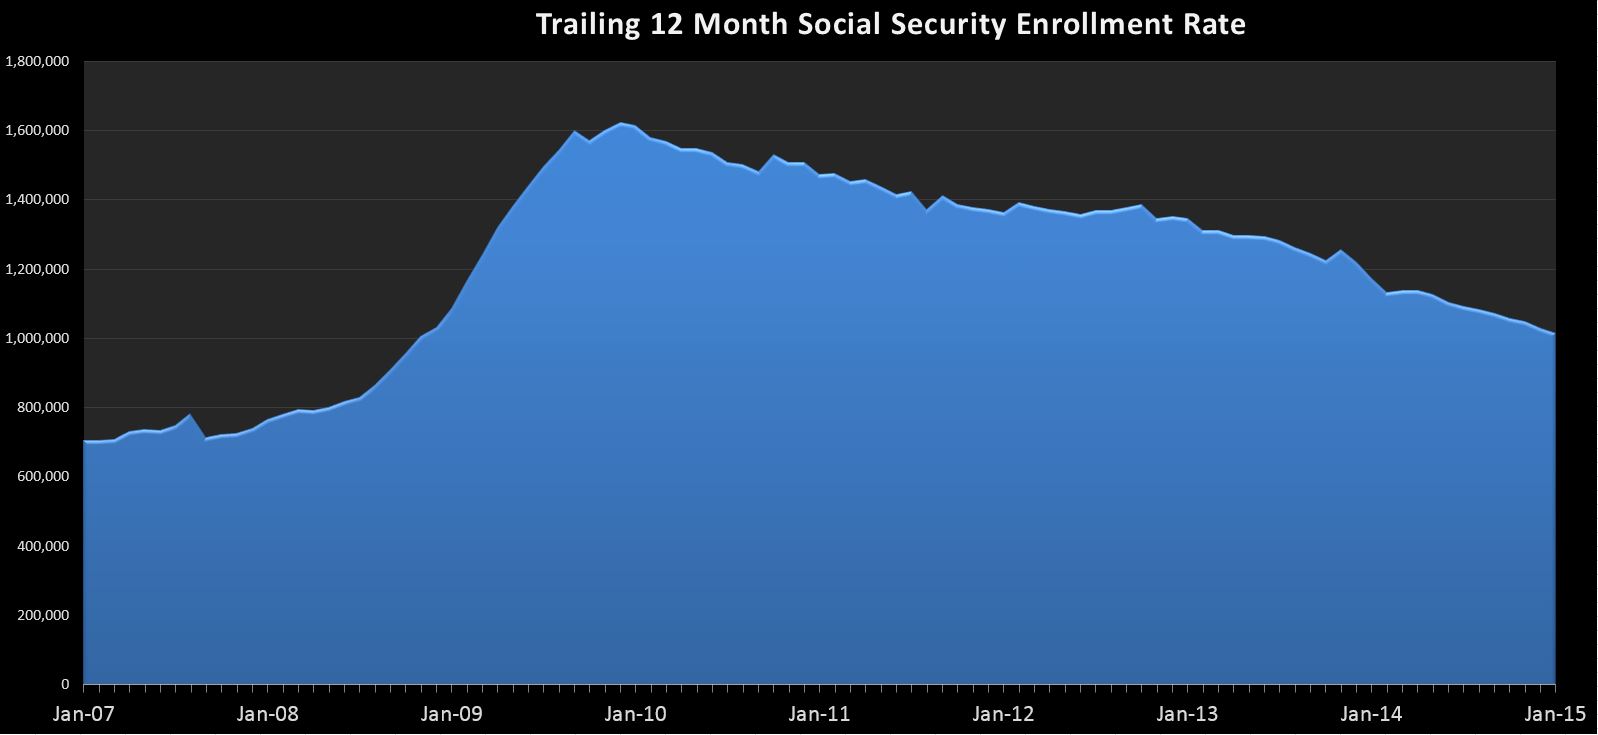
Here’s what you need to know….During the spike we saw in 2009+, most of the categories, especially disability and retired workers were growing in unison, leading to a peak growth rate of over 1.6M per year. However, since then, with the exception of retired workers, everything has more or less stabilized, including disabled workers which had been growing as much as 400k per year at one point. This leaves retired workers as the primary driver in program enrollee growth. So it’s no surprise that the trend is more or less the same…a continued decline in the annual enrolment rate that is still quite a bit higher than the historical trend.

Put it all together, and the truth is…not a whole lot to see here, and that’s a really good thing. If this chart starts to get interesting, there’s a good chance it will be because the deficit is zooming back toward $1T as revenues collapse and expenses spike higher…..just like the good ‘ol days 🙂

June 2014 Update: Social Security Enrollment

By | Commentary

The June 2014 numbers are in and show an 11k drop in SS rolls….from 58.586M at the end of May to 58.575M at the end of June. This represents the first drop in nearly 4 years, but it isn’t a huge surprise. The truth is, June and July are seasonally weak months. I don’t exactly know why, but most of the change seems to be the categories related to minors…maybe graduating seniors get dumped off the rolls each summer?? Reductions in minors offset a 75k increase in retired workers pulling the overall population down. Last June and July came in at +13k and +3k respectively, so while a reduction in the rolls is certainly a good thing….it represents a 24k reduction in the annual rate of gain….that rate still stands at 1.106M.

2014-07-10 June SS Analysis

Perhaps the chart can add a little perspective. It’s certainly not bad news though. The 4 month plateau we were discussing last month looks like it is giving way to a continued reduction in the annual rate. There is a good chance we will see further reductions next month, followed by an uptick leading into the fall.

All in all…I don’t see any dire warnings in this data indicating a 2008/2009 spike is on the way….so Party On!!….for now.

May 2014 Update: Social Security Enrollment

By | Commentary

The May 2014 numbers are in and we added 114k people to the SS rolls compared to 124k in May 2013.The total consolidated enrollment now stands at 58.589M…good for 18.41% of the population receiving an average of $1187 per month.2014-06-28 May SS Analysis

We can see what appears to be stabilization for four months now just a bit over a 1.1M annual rate of increase. I keep an eye on this series to catch a material change in the enrollment trend….in particular the beginning of another spike like we saw in 2008-2010. Clearly…we don’t see that this month. In fact, it’s not even clear that the stabilization is a trend…yet.

As of May 2014…the rate of change in SS EFT cash outlays was +$50B annualized. This is down from a peak of $65B in Dec 2012, but it’s still a big number….requiring $50B of new revenues each year just to keep the deficit even. That hasn’t been a problem in the last year…with revenues gaining at a $300B+ rate, but this is unlikely to be the case forever.

April 2014 Update: Social Security Enrollment

By | Commentary

The April 2014 SS numbers are in and we added 130,874 people to the consolidated headcount just barely edging last years 130,724 add by 150 people. The total consolidated enrollment now stands at 58.472M…good for 18.38% of the population.

2014-05-20 April SS Analysis

So in the big picture, we are still plodding along at an annualized rate adding about 1.1M people a year….pencil that out assuming new benefits at a rate of $1500/month, that’s about $20B per year…a big chunk of the programs ~50B growth rate….with the rest being primarily the COLA adjustments which are small, but being applied to a huge base.. At that rate, assuming everything else in the entire budget is frozen…we need about 1.6% annual growth in revenues just to stay even….or about what we just saw in April.

But the real reason I watch this series is because I am watching for a material change in the enrollment trend. Clearly we don’t have that this month. What we do have is two months of essentially no YOY change against over a 4 year trend of moderate decline. Two months in a row isn’t particularly alarming, but a few more would definitely be interesting.

March 2014 Update: Social Security Enrollment

By | Commentary

In March 2014 the SS rolls added 143k to the headcount bringing the total to 58.341M. This compares to a 138k add last March, breaking a 4 month string of improvement.

2014-04-14 March SS Analysis

It’s just a one month break in a downward trend dating back to the last peak in December 2009 at 1.6M, so it’s nothing to get excited about either way. The rolls are growing by over 1.1M people per year, and cash outlays are growing at 8% annually, which is a combination of additional people, COLA adjustments, and new retirees coming into the system with higher monthly payments than the people they are replacing.

As I’ve explained before, I monitor this series primarily to look for signs of a new spike similar to what we saw between 2008 and 2009. If this correlated with a decrease in revenues, we would have a pretty clear sign that a recession is either already in progress or imminent. As it stands, we see neither. Revenue is at all time highs and growing at about 12% through the first 100 days of 2014. Retirements…while still high historically, continue to trend down….slowly. It’s clearly too soon to declare that everything is going to be ok, but even I must admit….things have been a lot worse.