August 2015 Cash Deficit

By | Daily Deficit

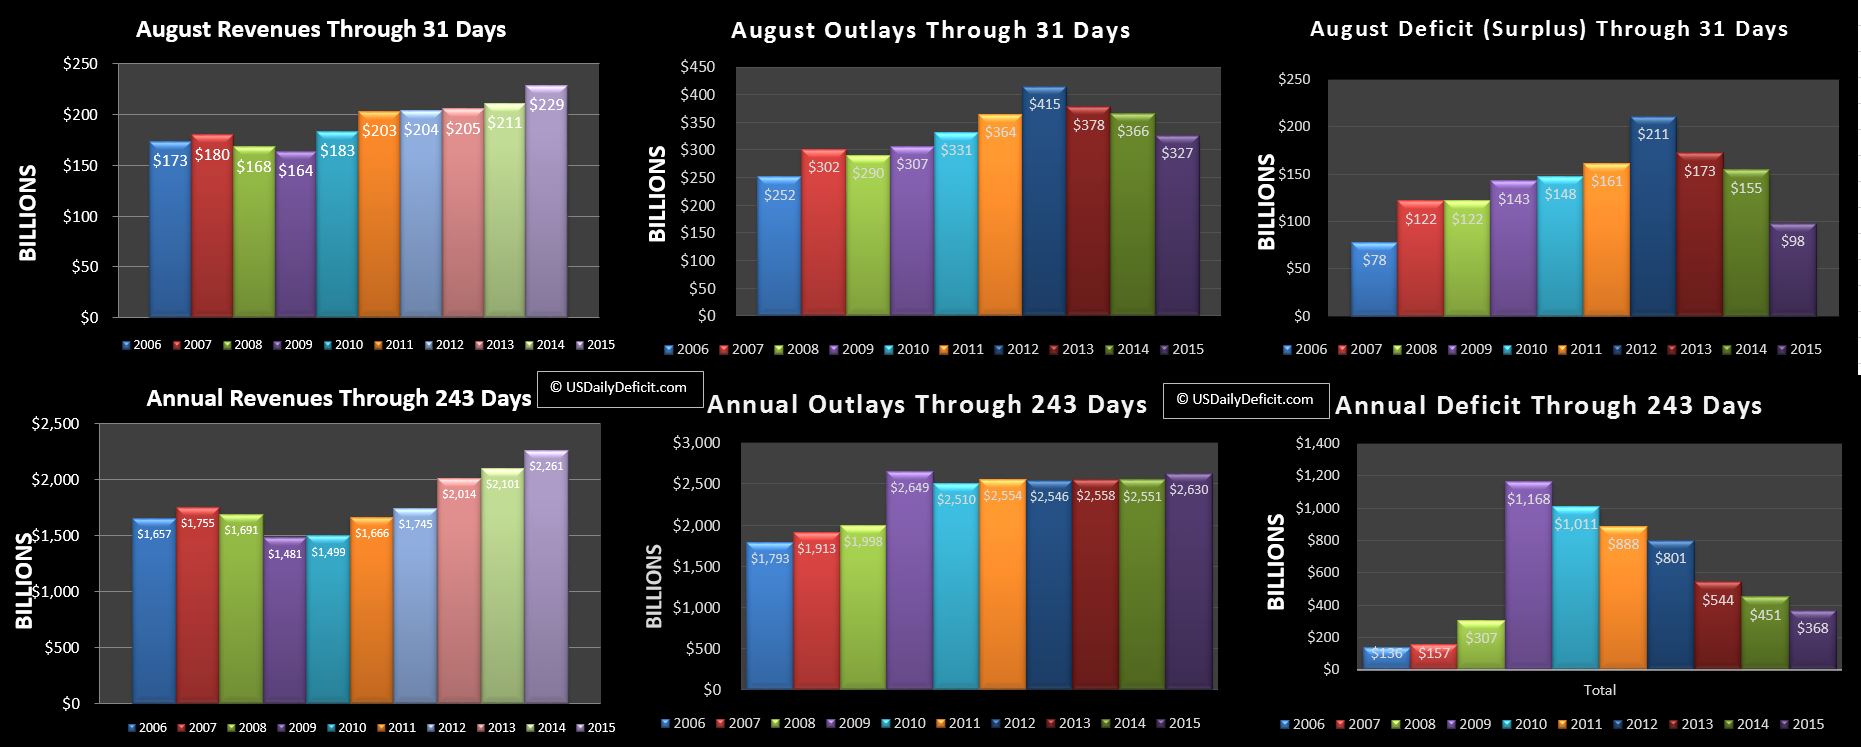
The US Daily Cash Deficit for August 2015 was $98B. This brings the 2015 year to date cash deficit to $368B, an $83B improvement over 2014’s $451B deficit through 8 months.

2015-08-31 USDD

Revenue:

Revenues were strong at +8.4%…the first month since April to break 5% breaking a 3 month streak. The year to date revenue gain stands at +7.6% which is a solid number, but it has been dropping fast. It will be interesting to see if September stays strong at +5% or dives back under and continues to pull down the YTD.

Outlays:

Outlays were down for the month due to timing but the YOY remains at +3%. For most of 2010-2014, we saw increases in outlays for Social Security, Medicare, and Medicaid offset by reductions in spending elsewhere….primarily stimulus, and defense keeping overall spending flat. In 2015, it looks like those other categories have flattened out while the big 3 continue to surge. It may not seem huge, but a 3% baseline increase in outlays adds  over $100B a year of spending a year growing exponentially.  Just to keep the deficit flat, a 3% increase in outlays needs a little less than 4% revenue growth to cover. Looking at the last 4 months…we’re at +4.9% including a pretty good August.

Deficit:

Through 8 months the deficit stands at $368B as revenue gains of $160B have been offset by a $79B increase in outlays. If current trends hold and we finish out the year with revenue at +5% and outlays at +3% 2015 will end up at $425-$450B for the full year ve $556B in 2014. Do note that the Feds current use of “Extrordinary Measures (EM)” has forced a methodology change and added an extra margin of error that we won’t be able to reconcile until the debt limit is raised again and EM ceases.

Default Day:

As we all know, the debt limit was hit back in March at $18.113T. Since then, Treasury has managed to keep the government going by drawing down the sizable cash stockpile (274B after the April tax haul) and by implementing  “Extrordinary Measures” (EM) which allows them to essentially pretend some types of debt do not exist….thus pulling it off the balance sheet and issuing new debt in it’s place. My guess of the amount of total EM available to treasury is $350B, of which they have used about $220B based on some back of the envelope calculations. The balance of $130B plus the current cash balance…$132B at the end of August gives us the cash cushion available to cover future deficits. At the end of August, this amount was ~$262B, down from ~$360B at the end of July. Looking forward using my model, $262B should last until about the middle of February 2016….just as tax refund season begins heating up again. This timeline hasn’t changed much and I don’t really expect it to…we have enough cash to make it to February, but making it through tax refund season is very unlikely, meaning that raising the debt limit will become a very big issue right around the time primaries for the 2016 presidential election are getting started.

September Forecast: 

September is a big revenue month as quarterly tax payments will start to flood in mid month. While August had 229B of cash revenues, look for September to come in just under $400B….so you can see that we have big swings in revenue moth to month. I’m going to forecast the September 2015 cash surplus  at $60B.
US Daily Cash Deficit 8/21/2015

By | Daily Deficit

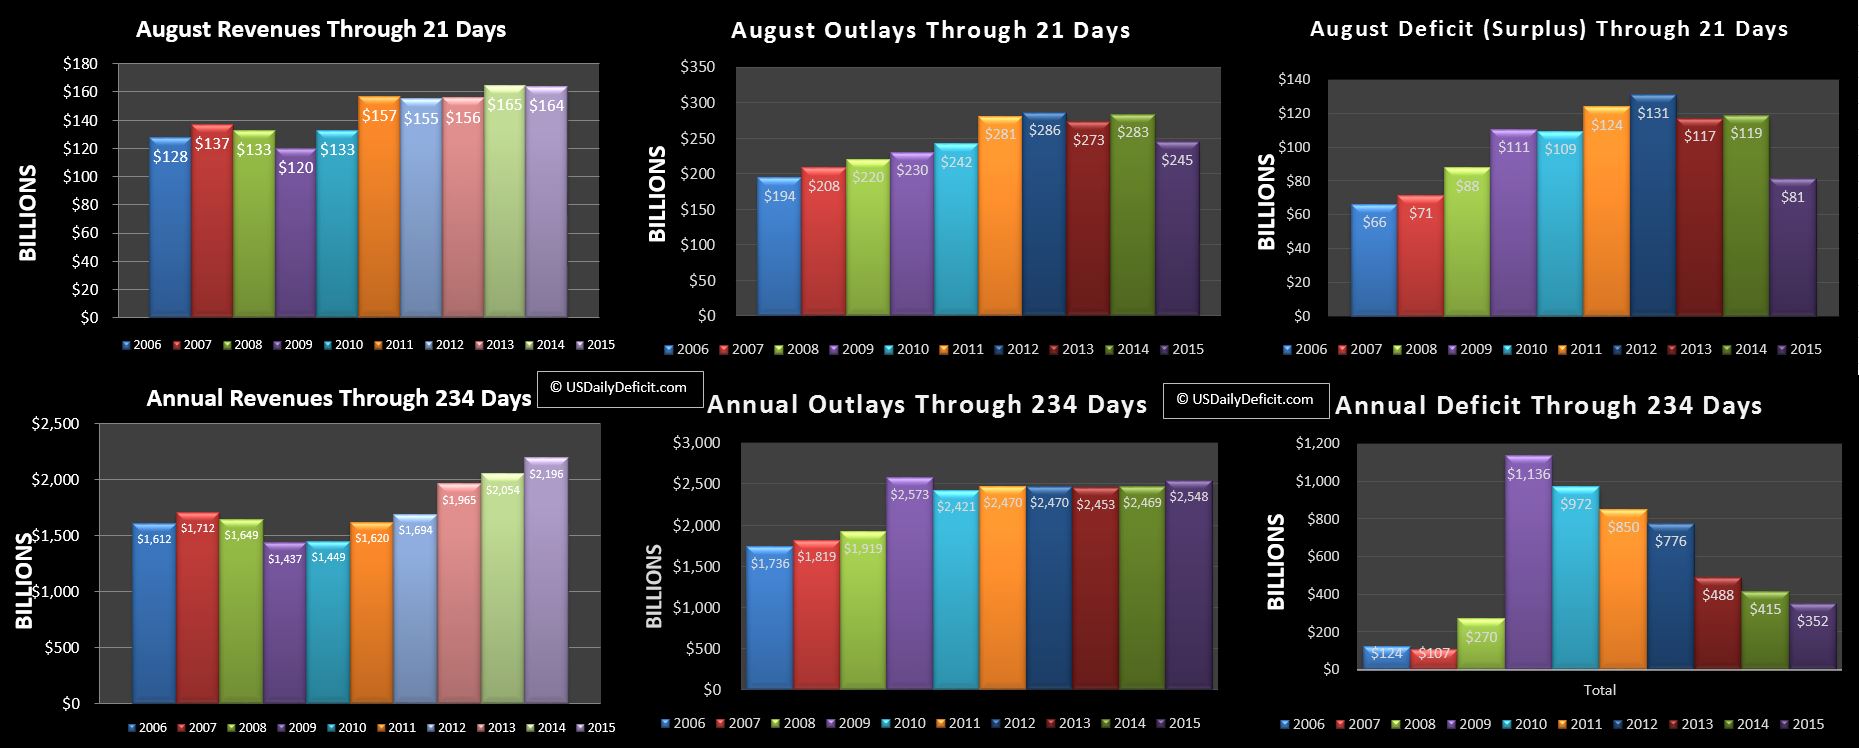
The US Daily Cash Deficit for Friday 8/21/2015 was $0.6B bringing the August deficit through 21 days to $81B.

2015-08-21 USDD

Revenues:….down $1B are mostly flat, but 2015 is currently down a business day which it will get back Monday 8/31, which should be good for ~$10B or so of revenue…pulling us to around +5%….if that’s how it shakes out.

Outlays: Down $38B primarily on month end timing. However, there was an $8B payment that went out 8/19 that appears to be related to the Afordable Care Act “Transitional Reinsurance Program”…google it for a really exciting read:) Now, $8B really isn’t a lot in the big picture…August will almost certainly have over $300B of cash outlays in total. However, it wasn’t in my initial forecast, and it is big enough to add a 2-3% bump in baseline outlay growth….if only for the month.

Year To Date:

Revenues are up 6.9% YOY, but continue to trend downward. Outlays are up 3.2%…. so if revenues are trending down to sub +5%, we could see the deficit bottoming out in 2015 at around $450B.

July 2015 Deficit

By | Daily Deficit

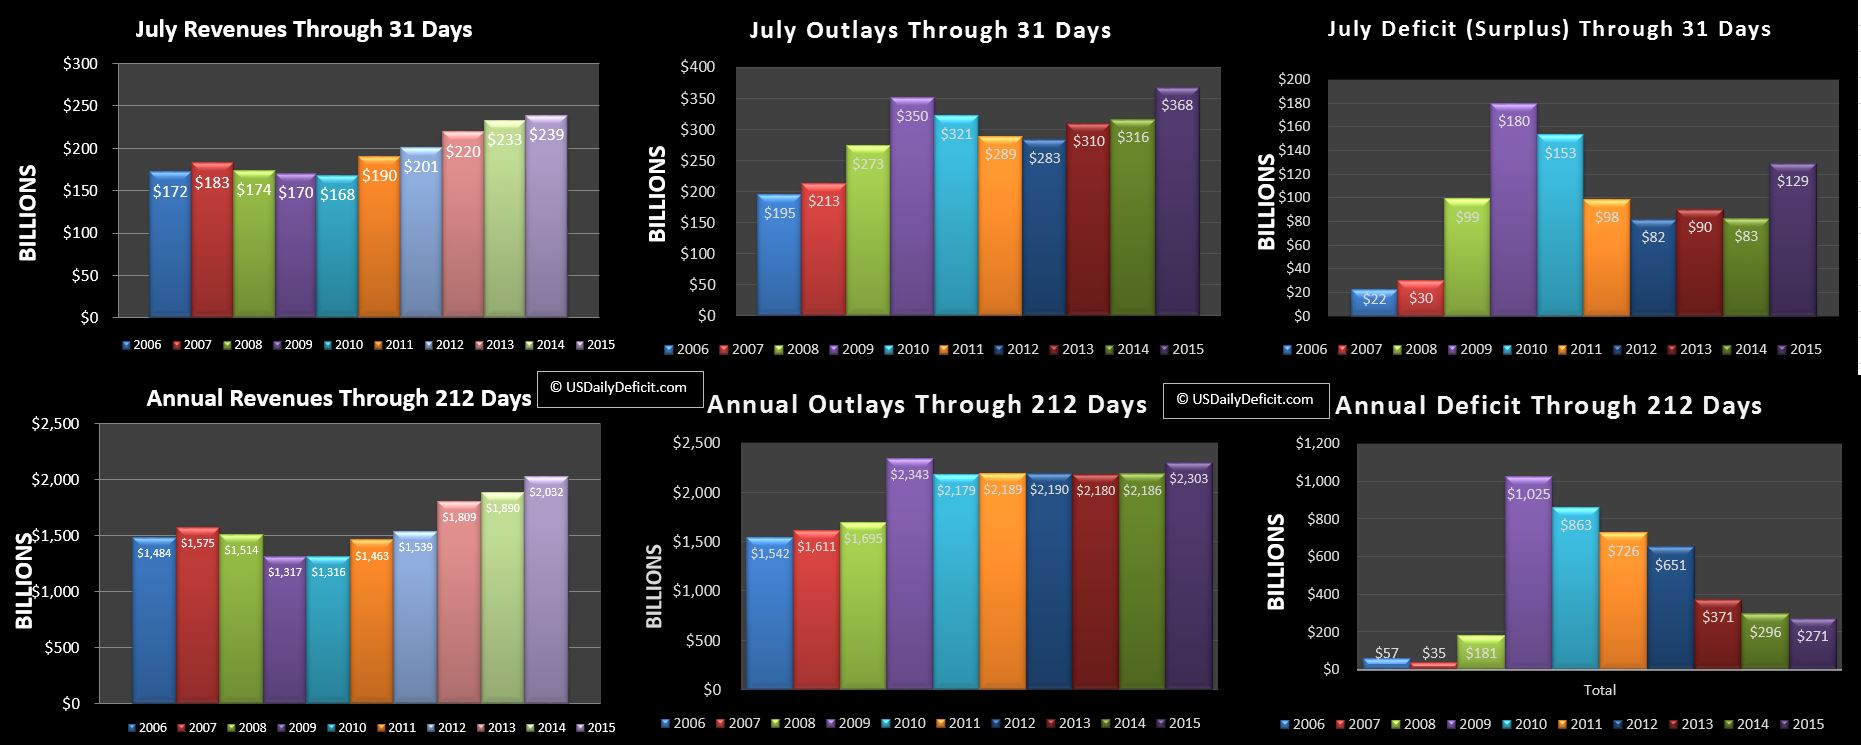
The US Daily Cash Deficit for July 2015 was $129B, topping my $115B forecast primarily due to a surge in Medicare and Medicaid cash outlays.

2015-07-31 USDD

Revenues:

Revenue was up just 2.5% in July compared to the Annual of +7%. However some of that was due to one time cash receipts last year that did not repeat in 2015. Tax deposits were actually up 8%, though pulling out the additional business day would put us closer to +5%. So revenue was a mixed bag in July…not impressive at first glance, but decent after pulling out one time items and timing. For the year, revenues through 7 months are up $142B ggod for a 7.5% YOY gain. This continues to fall as the last 3 months have all been below +5%.

Outlays:

Outlays were up big on timing and outright increases in Medicare/Medicaid/Social Security. August 1 falling on a weekend pulled $40-45B of spending  forward into July. Looking at the year through 7 months, cash outlays are up 5%, but pulling out the timing anomaly puts us closer to 3%.

Deficit:

At $129B, July 2015’s deficit tops last year by $46B….about the same as the timing event, so we should get most of that back in August. Three months doesn’t quite make a pattern, but after a solid start to 2015 with revenue at +10% through 4 months, we seem to be seeing ~5% revenue growth and ~3-4% outlay growth roughly offsetting each other and leaving the deficit itself relatively unchanged. The current trailing 12 month deficit is at $530B goosed a bit by the timing, but if current trends hold (and they never do) we would end the year at ~$450B, good for a YOY $100B improvement.

Default Day:

As we all know, the debt limit was hit back in March at $18.113T. Since then, Treasury has managed to keep the government going by drawing down the sizable cash stockpile (274B after the April tax haul) and by implementing  “Extrordinary Measures” (EM) which allows them to essentially pretend some types of debt do not exist….thus pulling it off the balance sheet and issuing new debt in it’s place. My guess of the amount of total EM available to treasury is $350B, of which they have used about $200B based on some back of the envelope calculations. This plus the current cash balance…$210B at the end of July gives us the cash cushion available to cover future deficits. At the end of July, this amount was ~$360B, down from ~490B at the end of June. Looking forward using my model, $360B should last until about the middle of February 2016….just as tax refund season begins heating up again. This is also right in the middle of the early presidential primaries, so it could get (more) entertaining if they don’t manage to deal with it sooner. My advice to the political establishment would be to fix this ASAP. Nothing would send voters into the arms of Donald Trump faster than having tax refunds delayed right in the middle of primary season. That’s not an endorsement (of anybody)….just saying 🙂

August Forecast:

I’m going to stick with revenue at +5% and outlays at about +3.5%, so pulling out the timing issues, I have the August 2015 cash deficit at $100B compared to last year’s $155B. As always, stay tuned!!

US Daily Deficit 7/21/2015

By | Daily Deficit

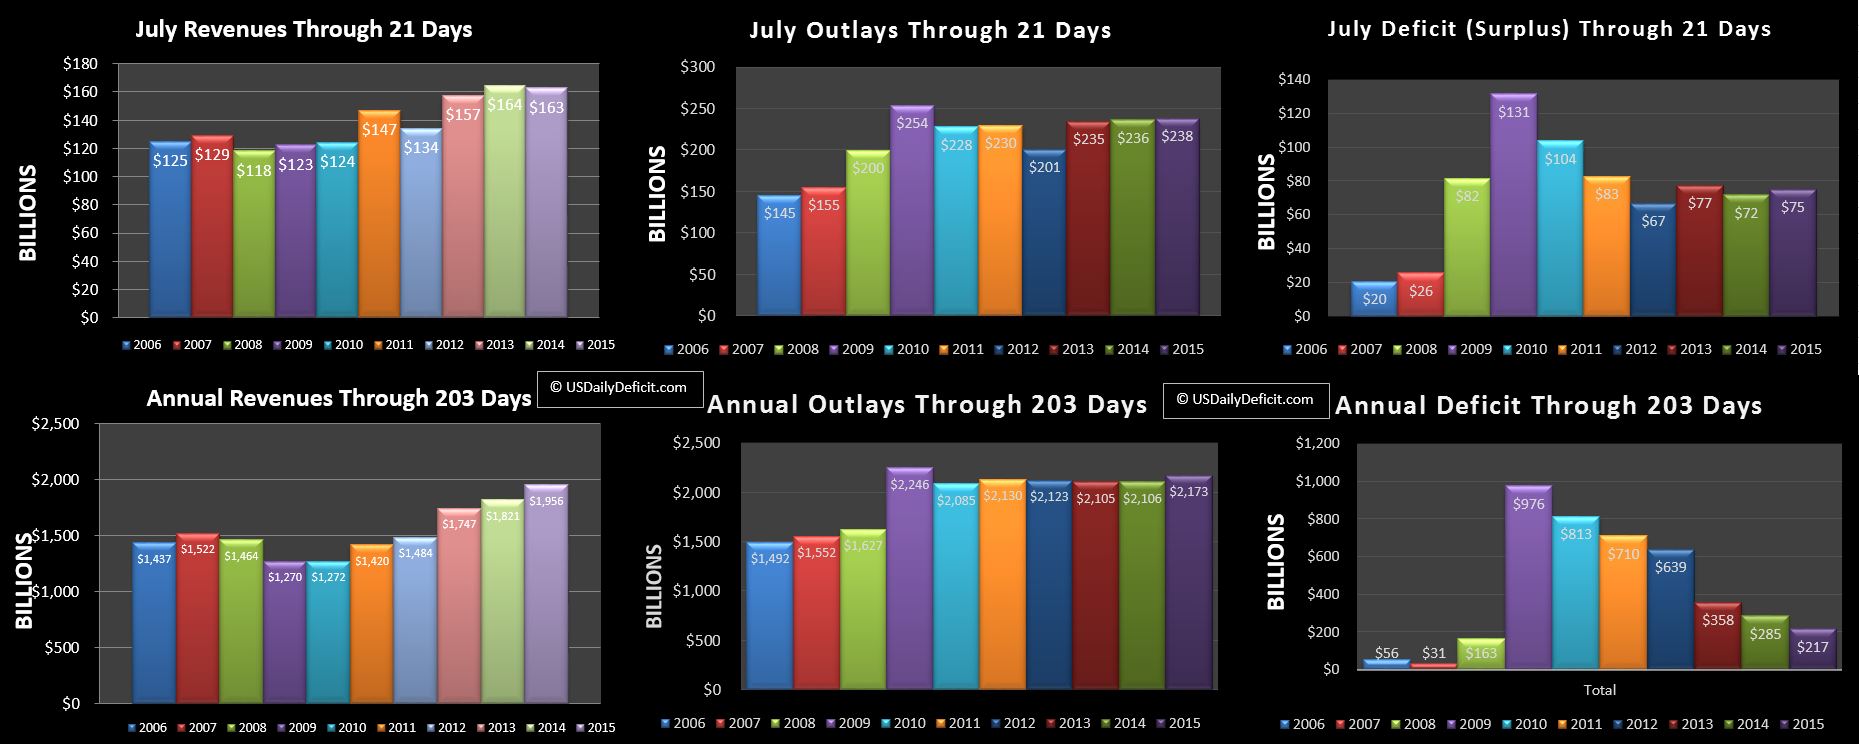
The Us Daily Cash Deficit for Tuesday 7/21/2015 was $8.9B bringing the July deficit through 21 days to $75B with 8 business days remaining.

2015-07-21 USDD

The revenue YOY is down $1B, with ~4B of that being Justice department receipts from last year we didn’t expect to see again. If you pull that out, revenues are at ~+2% and slowly gaining….+5% is definitely a possibility but not guaranteed to end the month. After starting the year through 4 months at +10% YOY revenue growth, May/June averaged only 4.5%, and we look like we are headed for a similar outcome. Slowdown?? On the other hand, I suppose +4.5% isn’t too bad, but with Outlays growing at +3.2%, it’s not enough to continue driving the deficit down at the rate we have seen over the last few years.