March 2013 Debt Update

By 04/02/2013Commentary
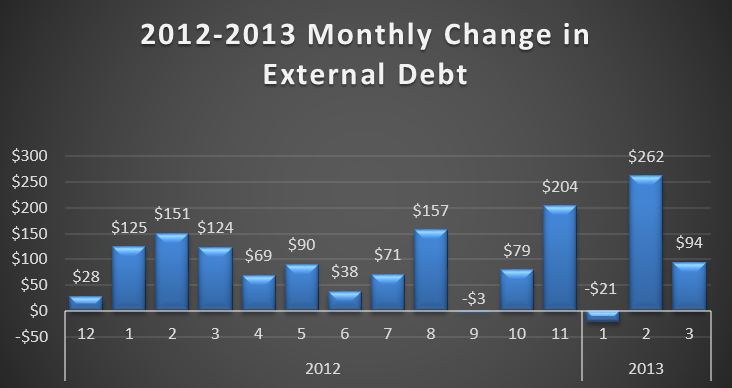
Over the course of March 2013, total debt outstanding increased $84B up from $16.687T to $16.771T. External debt…the only category that really matters was up $94B, but offset by a $10B decrease in the intragovernmental debt category….basically money we are pretending we loaned to ourselves, rather than admitting we already blew it.

2013-04-02 Monthly Debt Change

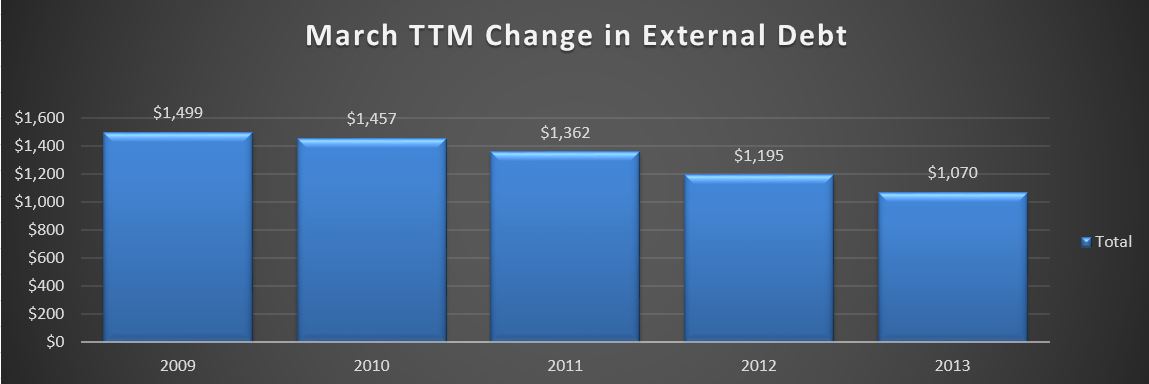
Moving on, the TTM (Trailing Twelve Month) change in debt:

2013-04-02 TTM Debt Change

This looks at the TTM change in external debt only for March of 2009-2013. For example, the 2013 amount of $1.070T is the difference between 3/31/2013 and 3/31/2012. …how much debt have we added over the last 12 months. I like TTM when looking at the debt and deficit because there is so much seasonal variation that looking at any one month doesn’t really tell you anything…like this month, April, will likely post a monthly surplus….but that doesn’t really tell you anything about the $1T or so annual deficit.
Looking at the chart (made in Excel 2013…not crazy about the grayish black fade), we can see a $125B improvement…the right direction no doubt, but at a tepid and declining pace…for now. At this pace…we would get to zero in 8.5 years…assuming the pace continued…it will not. What we will likely see is an acceleration through the remainder of the year thanks to the recent tax increases and relatively flat spending. Then, after a year or two of stabilization, it is going to turn the other way as the growth in outlays surpasses any revenue growth, driven primarily by the large welfare programs…Social Security, Medicare, and Medicaid.
Yes…I said it….these are all straight up welfare programs where one large voting block has forced a “generational contract” where the old and wealthy steal from the young and poor. This is justified by..” well, we were screwed too, so now we are gonna get ours.” Maybe so…but it’s not gonna work for much longer. This entire system needs to be abandoned and go back to the old way. Either you save enough on your own in your 40+ year career to sustain the retirement you want…or, your kids/extended family supports you…if they like you.. The end. The average person making $50k puts about $7,500 each year into the social security/medicare pot each year…. What could you do with $7500 per year? Probably pay off your house in 10 or 15 years and start amassing a lifetime supply of benefiber…. Ain’t retirement grand?
copernicus

Author copernicus

More posts by copernicus