Category

Daily Deficit

May 2018 US Cash Deficit $157B

By | Daily Deficit

Following April’s blowout $223B surplus comes May’s $157B deficit. They don’t quite zero out but there is plenty of bad news if you dig in.

Revenue:

Revenue was down $35B and 13% compared to last May….providing some validation that April may have been the last Hurrah for revenues. Just a recap on that…2017 taxes, with impressive stock gains and higher rates were by and large paid in full by the end of April….from here on out it’s lower rates….and likely lower tax receipts. If we take just April out of the YTD, revenue would have been down about 25B, and 2.5%… I know that doesn’t sound huge, but it pencils out to about $100B less per year in revenue at the same time outlays are increasing at the fastest rate in years.

Outlays:

Outlays were up $13B and 3% despite some favorable timing on interest payments. Looking at the year through 5 months, outlays are up $123B and 7%. That seems a little high to continue for the full year, but 4-5% seems reasonable.

I need to do a full piece on this at some point but one of the drivers is interest…not so long ago we had about $2T of short term debt at practically zero interest rate we were able to roll….that’s a great deal if you can get it and it really helps pull down your average. This has now changed…..and has recently surpassed 2% for 12 month Bills as of April…. In short…we are paying a lot more more to roll debt into a declining revenue and increasing outlay environment that will soon be adding another 1T of external debt annually…If that sounds like a recipe for disaster it’s because it is.

Deficit:

At $157B this was the highest since 2013 and $49B higher than last year For the year, 2018 is at $331B and looking at the annual we can clearly see a trend…after bottoming out in 2015, the deficit is stair stepping back up….hitting $900B in 2018 is looking quite likely and without a miracle we’ll probably top the $1T annual rate in early 2019.

Looking Forward to June:

June is a quarter end with pretty solid revenues. Usually this would lead to posting a small surplus, but this year, like last, due to July 1 falling on a weekend, a lot of July cost is going to get pulled forward into June. Last June posted a $24B deficit…I currently have June 2018 at about $30B…assuming a moderate 2% reduction in revenue.

Looking Forward to 2018+:

Not looking good is all I can say. April may have brought a breath of fresh air, but May was more like a sucker punch to the gut :)…. The evidence is pretty clear…April’s revenue surge was an anomaly….and for the rest of this year we are likely to see flat or even negative revenue YOY….along with 5%+ increases in outlays. It’s not certain…stay tuned of course but it’s not hard to pencil out how we post a $900B+ deficit in calendar 2018 and surge past $1T TTM just a few months into 2019.

We got away with the last 8 years because with interest rates near 0%…you can technically borrow as much money as you want for free…so long as you can keep rolling it. How will this all shake out and when?? I have no clue…I’m still shocked we made it this far. Perhaps the main thing you can do to protect yourself is to not lend Uncle Sam any of your money….

April 2018 Cash Surplus $223B – The last Hurrah?

By | Daily Deficit

And…We’re back!! Sorry for the late report….

Running a surplus in April isn’t exactly a surprise but hey, we’ll take it…$223B cash surplus…the biggest ever as far as my records go back.

Revenue:

After 3 months of anemic 1% growth (and falling) April looks like a grand slam with +65B of revenue good for a 14% YOY gain. That’s a big number folks!!….through 3 months we were at +$10B, and with one swing we are +$75B….from +1% to +6%.

But….there’s a catch….These admittedly impressive numbers represent the final deposit of 2017 taxes…with big stock gains and higher pre tax cut rates. Enjoy it….savor it….but don’t bet a lot of money expecting it to stick around. From here on out, we’ll be getting 2018 taxes, and halfway into May they aren’t looking so good. I’m not predicting a collapse, but even a decline of a few percent will start causing big cracks in the foundation of a system that requires exponential growth to hold off collapse.

Outlays:

Unfortunately…that hugely impressive revenue number was cut off at the knees by a +$47B and +18% YOY increase in outlays. Yeah…some of it was timing…we’ll never get away from that but looking at the YTD 1/3 of the way through the year and our spending is sitting at +109B…good for an 8% YOY spend. I am still sifting through the details but about half of that looks like the usual suspects…social security, medicare, medicaid, and defense. There’s also about $10B of some oddities from the debt limit… I suspect government employees shifting a lot of their Thrift Savings Plan balances (401k equivalent) out of US government bonds in the lead up to the debt limit hike. The rest is increased interest…both in payments and a big uptick in what I calculate as unamortized discounts…I’ll dig into that deeper someday, but I suspect this is what it looks like when you start refinancing your old 0.25% debt into new 2%+ rates….

Deficit:

$174B through 4 months is the highest since 2013…we are clearly going in the wrong direction…April was overall a good month and it helped a lot but it won’t be nearly enough if the other 11 months stink.

Looking Forward to May:

May 2017 posted a $108B deficit… With over half of the month already booked, May 2018 is looking more like a $150B deficit on timing, reduced tax reciepts, and a one time $19B payment last year related to the FCC spectrum auction that doesn’t look like we’ll see again this year..

Looking Forward to 2018+:

April’s revenues were huge… I said last month that anything can happen in April and put a wide +/-50B disclaimer on my estimate and still missed it….April Revenue came in at $+65B. But then…that huge good news was nearly wiped out by an increase in spending….If the rest of the year reverts to ~1% revenue growth or worse, and spending sticks at around +7%-8%…we are going to have some big problems by about this time next year, especially if April 2019 falls short of this year’s revenue boom. There is a lot of uncertainty, but 2017 posted a $710B cash deficit….2018 is zeroing in on the $800B-$900B range, and as noted we could have a run rate over $1T by about this time next year if not sooner. If we get a few more bad months confirming what we saw in January-March…it might be time to get the red siren out. Stay tuned!!

February-March 2018 Cash Deficits

By | Daily Deficit, Debt Limit

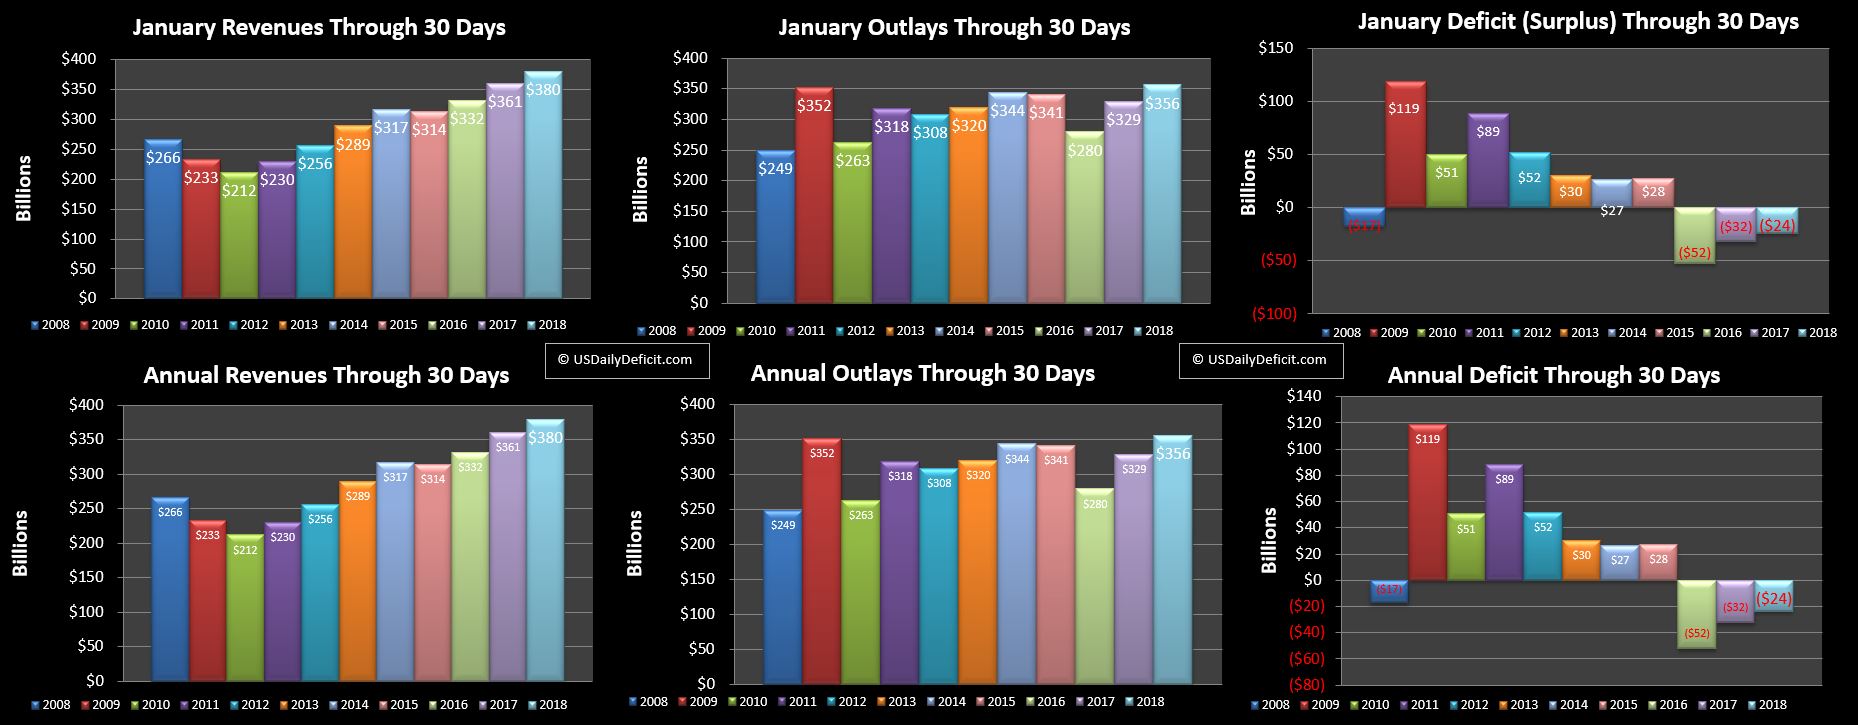
Well…I’m a bit behind so let’s play catch up. January, if you recall posted a $24B surplus which was welcome but smaller than January 2017’s $32B surplus. It was an odd month…with an extra business day and “extrordinary measures” ongoing since the debt limit was not raised until early February. All together, revenues were up 5%, but outlays were up 8%…so the surplus declined.

Now time for my “Extrordinary Measures(EM)” Rant 🙂 As you all know, EM allows treasury to hide certain kinds of debt…making them disappear from the balance sheet…so they can issue new debt in its place…using those cash proceeds to fund the government when we are bumped up against the debt limit.

Now…what’s the point of a “debt limit” that you can essentially ignore to the tune of $300B??…but that’s not what my rant is about. We’ve gone over it before, but the cash deficit is an extremely simple concept….we look at the change in debt and the change in cash over a given period, and that’s the cash deficit. So if in a given day(or month)…treasury issues $100B of debt (debt +$100B) and cash balances increase $50B, we would say that the cash deficit for the day was $50B. We don’t book the deficit until the cash flows out the door. This used to not be an issue, but since 2008, Treasury has carried cash balances between a low of $3B and a high if $715B, where as before they kept it pretty flat at around $25B. Bottom line…if we ignore changes in cash, we can understate or overstate deficit/surplus by hundreds of billions for a given month.

Back to the rant :)… EM essentially nukes this math. I can estimate it during EM, but it can be off by ~5B a month. So…WHat I have to do after EM is finished is recalculate the deficit from the start of EM to the end…..figure out how much I missed it by, then I just divide that by the number of days and plug in an adjustment….which drives me nuts. It’s not huge, but essentially is taints year over year variances for a year or so, and since we play this game every 18 months or so, it just drives the accountant in me nuts….rant off, and thanks for bearing with me:)

Now… to catch up…Real quick, let’s use the EM adjusted numbers…January improves a bit posting a $30B surplus and February is below:

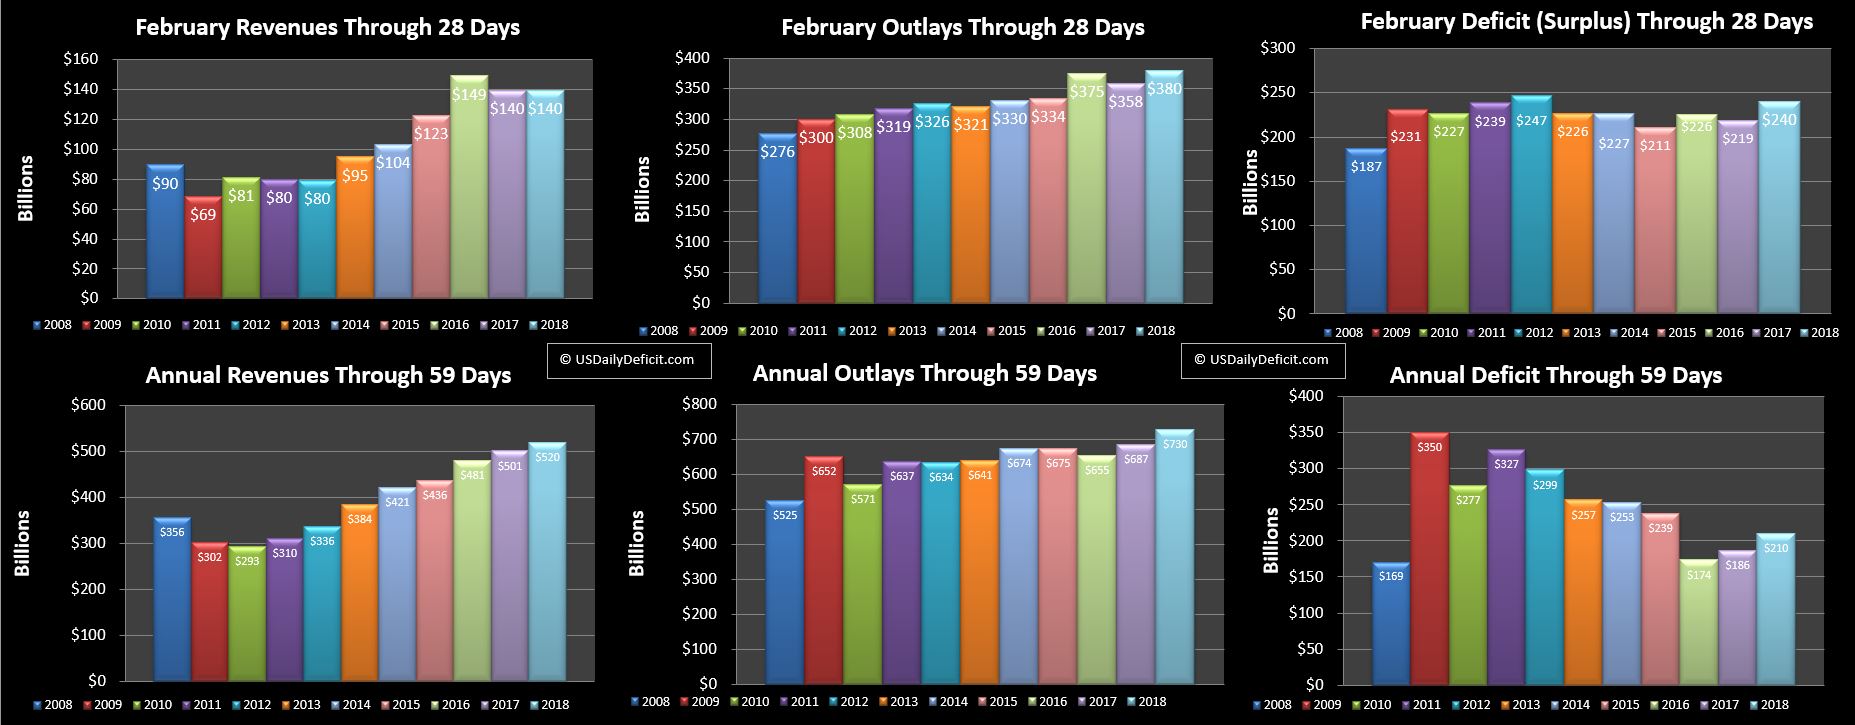
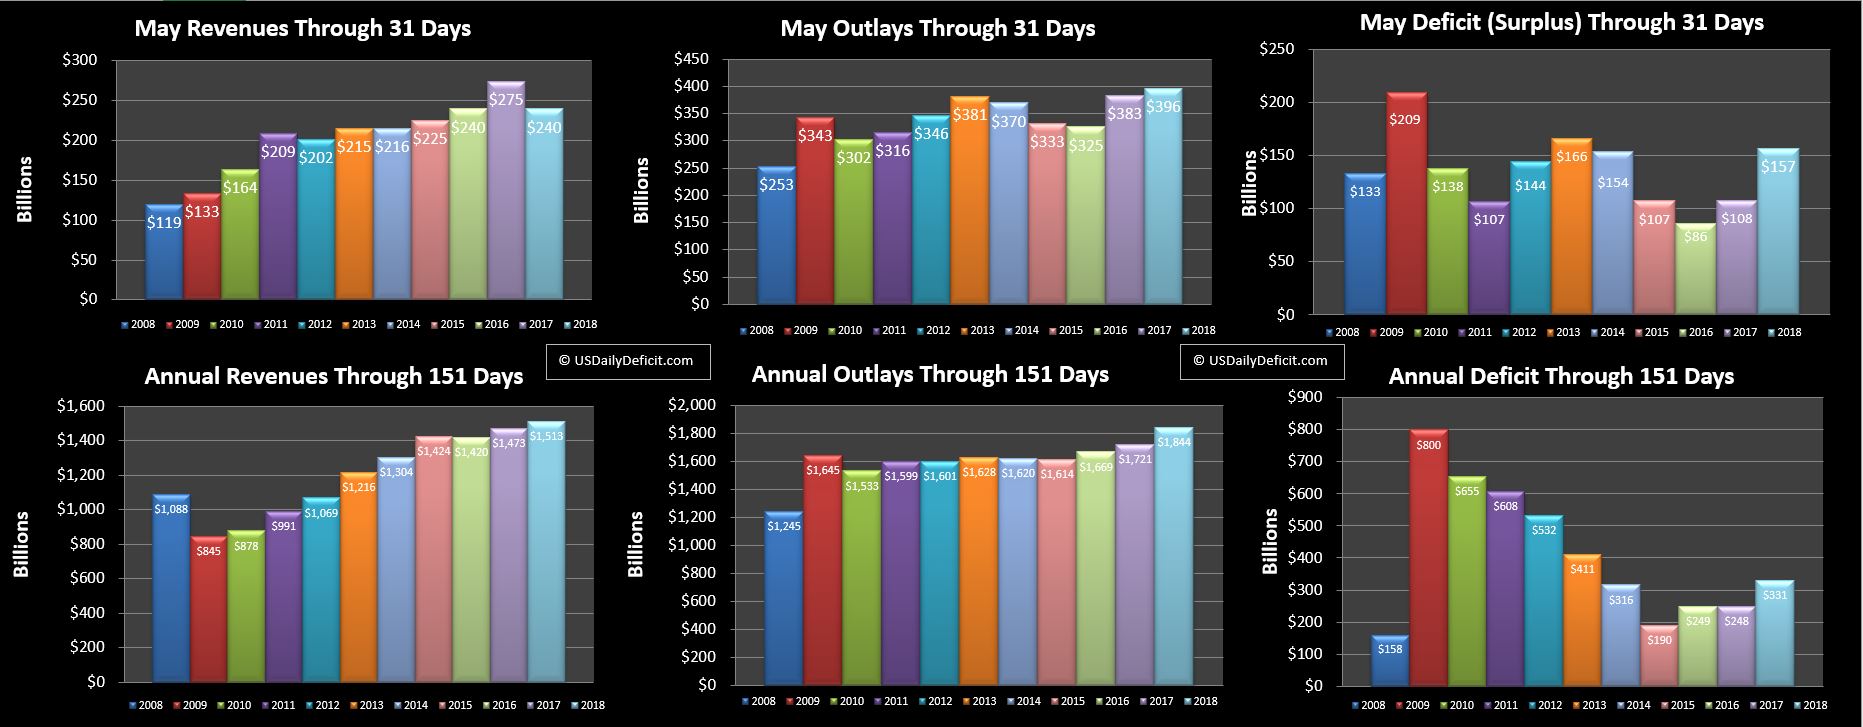
February always has a massive deficit due to tax refunds, so while $240B isn’t a surprise it tops 2017 by $21B, and that’s more than a rounding error. We see that revenues are flat and outlays are up….remember that because it is likely to be the story of 2018.

And now let’s look at March:

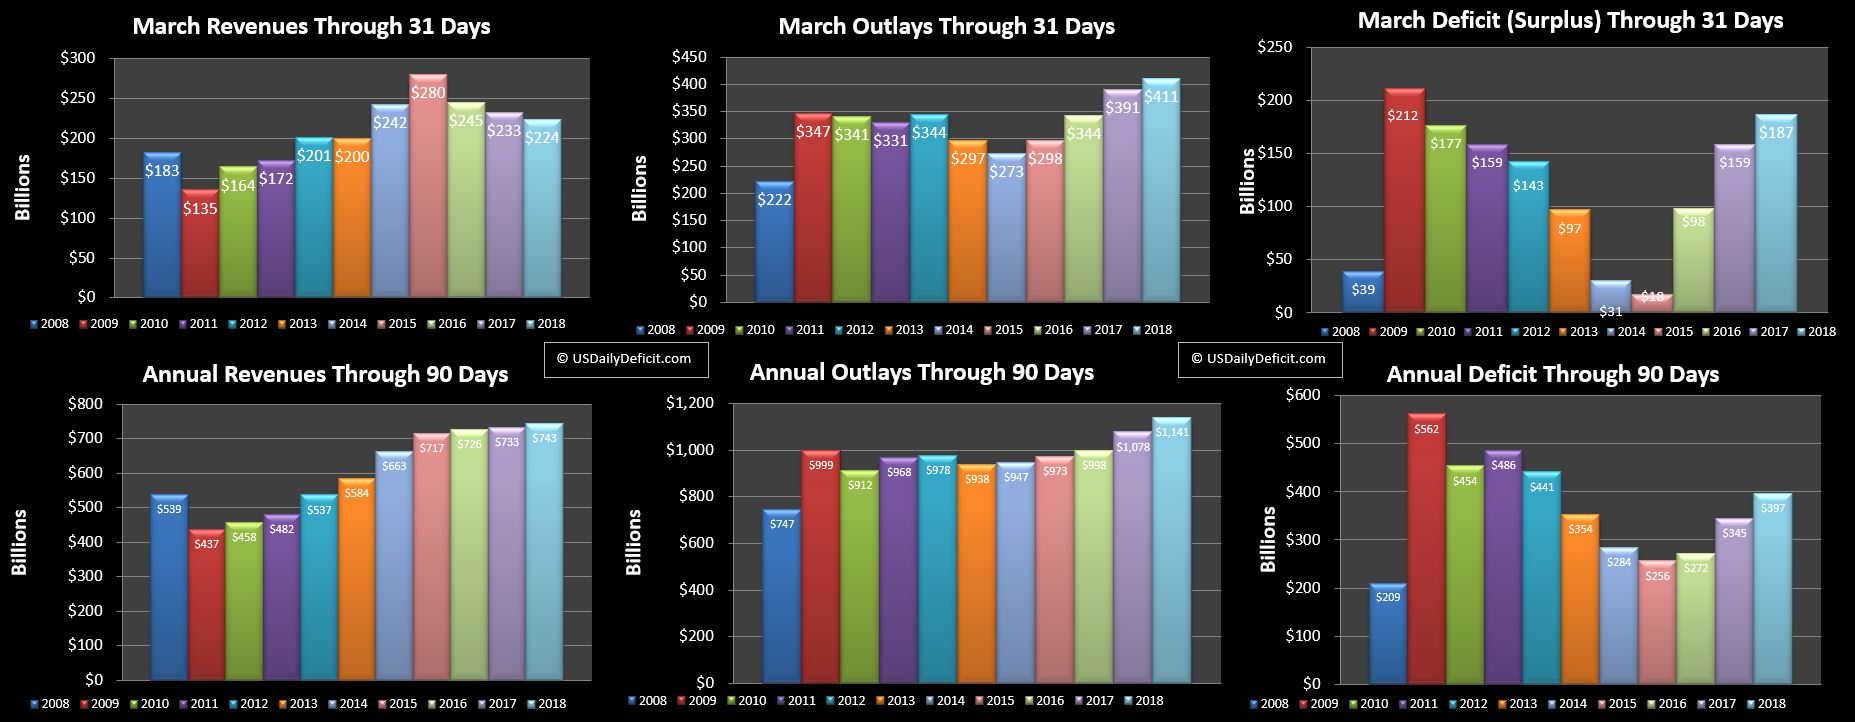
Again, March is a big deficit month, so this isn’t a big surprise but $187B is $28B higher than last year. Pay attention guys….it might be time to start getting worried.

Revenues:

Recall January….unaffected by the tax law changes actually posted a good revenue month. February was flat YOY and now we have an actual decline. Looking at the year through 3 months 2018 is still holding on to its January lead but it is only $10B and +1.4%…..and apparently declining. Now, April is always a wildcard with tax day 4/15…it could save the day or blow a hole in the whole year…we’ll know more in a few weeks. Looking at the big picture beyond April, while my crystal ball is as hazy as ever, we now have a few data points that indicate the tax cuts are indeed reducing tax receipts….nothing huge, just a few percent probably….but that’s a material difference from the past where revenue growth was at least a few percent positive and able to somewhat blunt the deficit impact of growing outlays.

Outlays:

While revenues are at +1.4% and declining, Outlays are up huge at +5.8%. That may not seem so massive, but when the federal budget is $4.3T….that’s about +$250B a year, and without revenue gains to offset it it’s not hard to see how we could be knocking on $1T deficits by the end of the year and blowing past it in 2019, and that’s assuming business as usual….can we assume that with all the craziness going on? I guess we still have hope 🙂

Deficit:

Through 3 months we are sitting at $397B, $52B over last year, and as noted above, the problem is simple…revenue is up 1%, outlays are up 6%. We can swing that for a quarter, or even a year….but all it will take is a few years of compounding and …well…you do the math:)

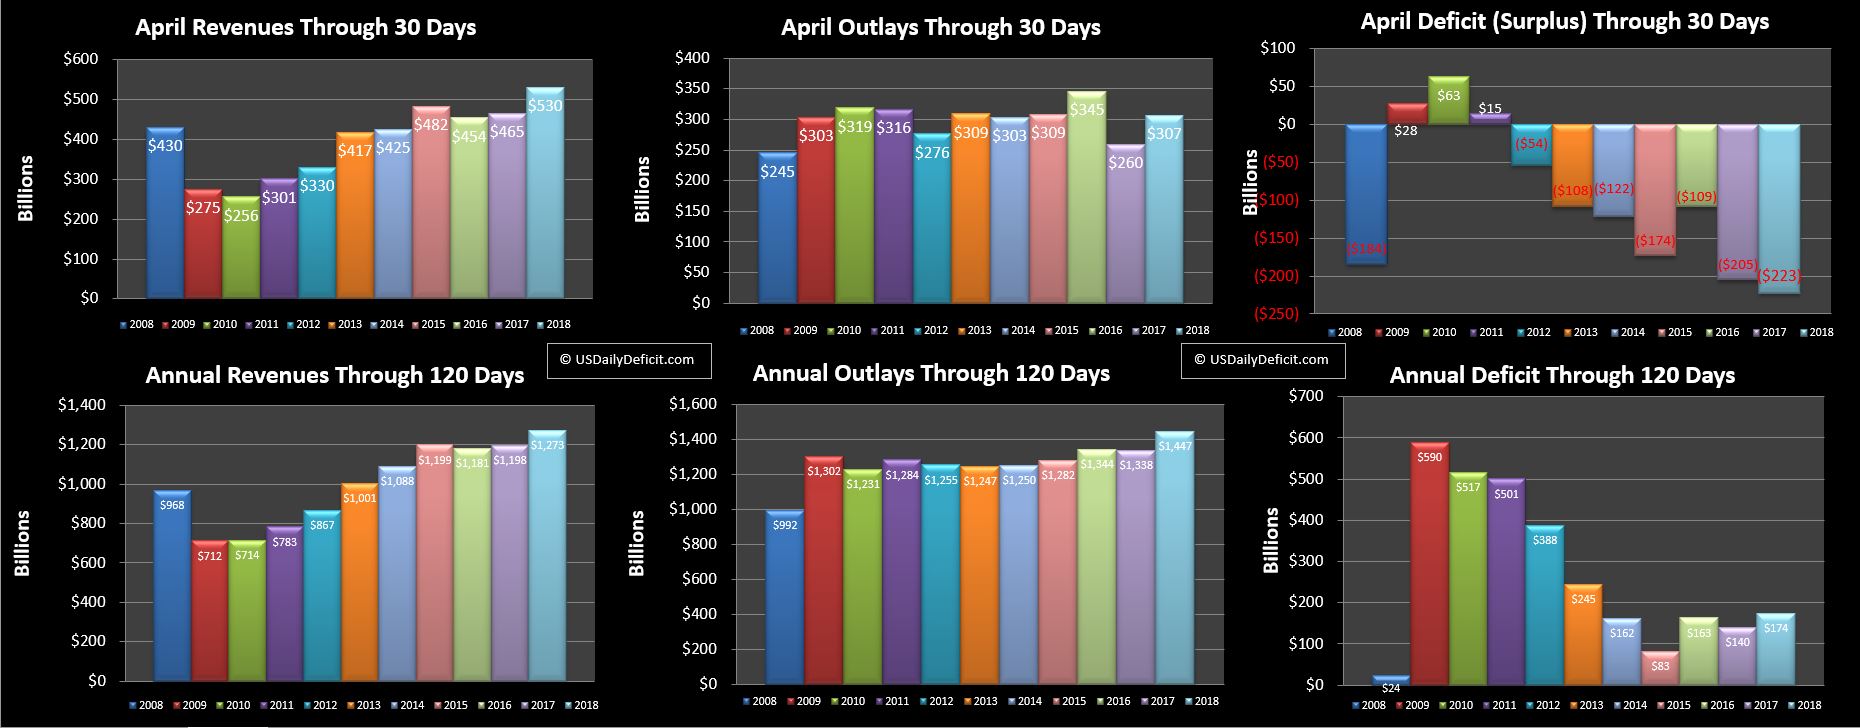
Looking Forward to April:

April is tax month, so look for a big surplus to provide some temporary relief to our current $400B deficit through the first quarter alone. Last April we had a $206B surplus and that seems like a reasonable estimate again, but April can be wild, so +/- $50B to cover:)

Looking Forward 2018+:

I’ve been watching this series for long enough to know better than to get too excited over a few months of data, but my eyebrows are definitely raised by February and March revenue data. There are a few one off’s in there that make it look better than it really is, and +1.4% doesn’t look good at all. Now, I know this site is called the Daily Deficit, but the truth is I haven’t reported daily deficit numbers in a while…though I do still track them daily here.  

For years now, if you lined up the days of the week with the prior year, you could see that withheld taxes were edging up…just a few percent, a few tens of millions, perhaps a hundred million in a given day. This made sense…more people were employed, maybe making a little bit more money, so Uncle Sam got a little more each day. Now, for the first time since 2008/2009…this is not the case. Obviously we know why, and for those who got tax cuts that’s not exactly bad news, but I have to wonder if perhaps the end is getting near.

It’s no secret the US government will ultimately default on its debt….the on($21T+) and off balance sheet debt ($100T+??) is unpayable, and has been for a long time now…nobody wants to talk about it, but it’s true and indisputable. However….with interest rates near 0, and the deficit more or less stabilized at $500B +/-$200B…as recently as a few years ago it looked like the game could go on, if not forever, perhaps maybe a few decades more??

That equilibrium now appears to be on the brink of being nuked. If the above discussed rates hold, or even get worse, we could be blowing through $1T annual deficit by early next year and past $2T just 3-4 years later. I’ve been wrong before (and will be again) but I don’t think we’ll get too many years of $2T deficits in the bank before it all goes boom….not that this would be a bad thing….For those not foolish enough to lend Uncle Sam tens of trillions of dollars, post Bankruptcy USA might just be a good place to enjoy the American Dream!!

As always…stay tuned!! April’s going to be exciting so I’ll try to do a mid month update, but no promises.

January 2018 US Cash Surplus $24B

By | Daily Deficit

The good news is we start the year with a surplus, but that was more or less expected….January is in general a strong revenue month as un-withheld tax deposits start flowing in…$75B in January vs. $13B in December. Last January ran a $32B surplus and January 2018 comes in just a little lower at $24B.

Revenue

Tax cuts may have been passed for 2018 but 2017 taxes are still flowing into the coffers leading to a $19B, and 5% YOY increase…not a bad start to 2018. Don’t get too excited yet….most of that can be chalked up to an additional business day. New tax withholding tables were released and supposed to be implemented in February…I think I can see it in the February data but it will be March before we really have enough data points to be sure. From here out…just staying flat should be seen as a win, so I don’t really expect that $19B YOY lead to hold for long, though tax refund season can always throw us for a loop either way.

Outlays

Outlays increased YOY by $27B, food for an 8% bump, more than offsetting the revenue gains. As with revenue, the extra business day is part of it…there were increases pretty much accross the board but the Thrift Savings plan jumps out…$3B  January 2017 to $13B last month. I don’t have an inside scoop here, but basically this is the government employees equivalent of a 401K plan. My guess is that this movement is related to when federal employees invest in US governent bonds. In normal times, there are a few $B going in and out of the fund in any given month. However, whenever we hit the debt limit and enact “Extrordinary Measures” it looks to me like Federal employees/(retirees??) start pulling out money hand over fist. Now that the debt limit has been suspended again, I would expect that to calm down and settle back into the $2-3B per month range.

Outlook

While January has become a reliable surplus month, February is always the worst month of the year as tax refunds start flowing out at around $100B per month. Add to that some big interest payments and generally weak revenues and we will likely post a February deficit in the ballpark of $250B with the primary variable being tax refunds. For the full year, the recent deal to avoid a shutdown and increase the debt limit supposedly added close to $400B of spending over the next 2 years including nearly $100B of disaster aid. I don’t have a good feel for the timing, but spread equally that’s about $17B a month or a 5% increase by itself, not including the baseline increases we already expect like the gradual march upwards in Social Security, Medicare, and Medicaid. I will stay tuned for details but a $1T deficit in 2018 is looking more likely by the day.

December 2017 US Cash Deficit $10B, 2017 Cash Deficit $710B

By | Daily Deficit, Debt Limit

Nothing really interesting about December’s $10B deficit, but we now have a total for 2017 which rang up at $710B, $13B higher than 2016’s $697B deficit. This is the highest annual deficit since 2012 topping 2013’s deficit by just $1B and is the second year in a row of increases.

Digging in a bit, revenues were up a solid 3.1% while outlays were up 2.9%, more or less cancelling each other out, leaving us with just a 2% increase in the deficit.  Looking at the Wayback machine, it looks like last January I eyeballed 2017 with a 4% increase in outlays and a 2% increase in revenues, which penciled out to an $800B deficit. Not a great estimate, but good enough I suppose. It’s hard to be happy about a $710B/Y deficit, but looking forward, it’s hard to imagine it gets any better from here.

2018 Forecast

We don’t want to think too hard about it, so on the outlays side, I’ll go back to the +4% growth, which is $170B for the year or $14B/month. Now the biggy…tax cuts. While they go into effect January 1, it’s not quite that simple…2017 taxes will still be flowing in through April 15th, and the withholding tables are unlikely to be updated before February, so calendar 2018 won’t quite get a full year of tax cuts showing up in the cash receipts. I’ve seen quite a few estimates all over the place, so lacking any data to do real analysis…I’ll just pick a nice round, and conservative number, and say cash receipts in 2018 will decrease by $100B, pulling revenue down from $3.55T in 2017 to $3.45T in 2018. Following the logic, this will be weighted in the second half of the year, and overall pencils out to about a 3% YOY decrease.

So…quick math…+170B outlays and -100B revenues puts the 2018 cash deficit at around $980B, $270B higher than 2017 and right back to knocking on $1T. Yikes!!that didn’t take long…maybe we should be happy it took them a year? Nah…I mean once you have $20T of debt, do another few hundred billion really even matter? I doubt it.

Default Near?

When will the US default and how?  The truth is that this can continue as long as Treasury can continue to issue a trillion dollars of new debt annually at ~2% rates to new fools, the Fed, algos etc… Don’t get me wrong…this debt can never be repaid…it will either be inflated away or officially defaulted on. Maybe that’s what the stock and housing markets are telling us….maybe they aren’t at high’s…the USD is just worth that much less and people are hedging against it’s decline by bidding up the price of tangible assets and companies that own them. Just a thought that’s been rolling around in the back of my head for a whle. Whenever it happens…I for one will not feel sorry for the blind fools who even for a second believed US debt was risk free.