Category

Daily Deficit

Daily US Deficit For 12/17/2012

By | Daily Deficit

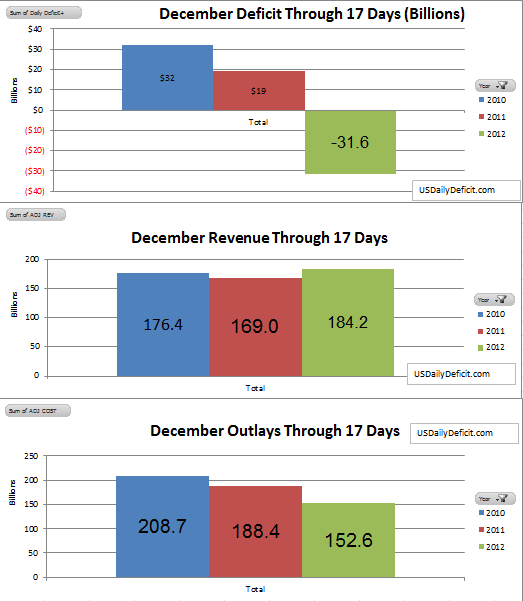
As expected, revenue continues to pour into the federal coffers leading to a $55.6B Surplus for 12/17/2012, bringing December 2012 to a surplus of $31.6B through 17 days. There are still a lot of days left, but with the majority of the corporate taxes in the books, there is a noticable increase in tax revenues over last year. If revenues continue to be strong, and costs stay on trend, we could be very close to a surplus by month end, which would be the first since 2007. I can’t prove this, but It is possible people and companies are making financial moves to pull profits into 2012’s low tax environment and push losses into 2013. Whatever the case, from a daily deficit perspective, the next month or so looks to be fairly smooth waters leading up to February, which will likely be a $200B+ deficit.

12-17 USDD


Daily US Deficit For 12/14/2012

By | Daily Deficit
The Daily Surplus for 12/14 was $19.8B, bringing the deficit for the month of December down to $24B through 14 days, an apparent $38B improvement over December 2011 through 14 days.
That may sound good, but most of the apparent improvement this month is due to timing. First off, about $30B of payments for 12/1 went out 11/30 because of the weekend, and second, the timing of corporate income taxes, due 12/15, was also thrown off by the weekend, but this should work itself out of the noise in the next day or two.
Now let’s take a look at Revenue and Outlays, which of course we subtract to get to the deficit. Revenue for 12/14 was $30.9B, making it the highest revenue haul since 9/17. The key driver in both of these dates, as mentioned above is the quarterly corporate income tax due around the 15th the third month in every quarter. Also adding to revenues was an $8B contribution from TARP, the gift that keeps on giving, at least from a deficit perspective. When analyzing the deficit from a cash perspective, we counted TARP as a deficit when the cash went out the door in 2008/2009. However, that money wasn’t really all lost, as a sizable portion of TARP was, and continues to be paid back. Today’s $8B payment is the first significant payment of this fiscal year. FY 2012 had a total of $66B, so the run rate seems to be slowing exactly as one would expect.
Through 14 days, December 2012 revenue is running $14B behind last year, though I suspect this is all timing related to how the weekend fell versus last year. I’ll be more impressed if the number holds through this Friday.
Moving on, total outlays for the day were $11B with the only significant outlay being $2.8B for Military Active Duty Pay. This brought the December 2012 total to $143B, $23B under last year, primarily due to timing.
All in all, 12/14 was a pretty good day from a deficit perspective. At the end of the day, debt outstanding was reduced $10.B and cash in hand increased  $10B, bringing the debt limit cushion(Cash + borrowing ability) to $112B. Look to see another sizable surplus 12/17 and above average revenues for the rest of the week. I will do some more forecasting at the end of the week when we have a more complete data set, but for now, I am still estimating the December 2012 deficit comes in somewhere around $30B.

12-14 USDD

Daily US Deficit For 12/12/2012

By | Daily Deficit
The Daily Deficit for 12/12/2012 was $7.1B, bringing the December deficit through 12 days to $39.6B. We see pretty significant year on year change compared to yesterday’s post, due primarily to a $14B of Revenue 12/12/2011 related to the GSE MBS Purchase Program. It is not clear whether we will see a similar payment in December 2012.


Daily US Deficit For 12/11/2012

By | Daily Deficit
The daily Deficit for 12/11 was $5.2B on $4.7B in revenues and $9.9B in outlays.

Through 11 days, we really aren’t seeing much change over the last update. The apparent improvement over 2011/2010 is primarily due to 12/2012 payments getting pushed to 11/30 because of the weekend. There is potential for some true revenue improvement if the trend holds, but that won’t really solidify until the middle of next week when we get a glimpse at corporate tax receipts. With Social security ETF’s going out today, we will probably see a $10B deficit in tomorrow’s report.

The Big Picture

By | Daily Deficit, Debt Limit, Fiscal Cliff
     This is a repost from November…I’m bringing it back to the top for the new visitors we are seeing from Seeking Alpha
The chart below shows us what I believe is the most comprehensive metric for tracking our debt and deficit woes…the Trailing Twelve Month Deficit (TTMD). The TTMD is important because costs and revenues can swing wildly from month to month, but do exhibit annual patterns, so comparing a month to the same month a year ago is a much better indicator of whether the deficit is growing or shrinking than comparing it to the prior month. February is a great example. Most folks get all the tax forms they need to complete their taxes by the end of January, submit them, and get their tax refunds in February. This makes February the worst month of the year, with a $249B deficit in 2012. April, on the other hand, just 2 months later is generally the best month of the year, as those who owe taxes wait until the 4/15 deadline to pay. In 2012, April posted a surplus of $58B. If you were trying to project a trend over the Feb-April period…you simply would not have much success.  The TTM solves this and in  my opinion gives us a superior metric.

     Looking at our chart, we can see that we end 1999 with a $190B TTM Surplus, which grows and peaks at $307B in Jan. 2001. At that point we see the trend reverse, going negative in 2/2002 and leveling off around a $300B annual deficit. By 2006, we start to see some improvement, getting within $64B of a surplus in 4/2007. Then, things start deteriorating again, ultimately falling off a cliff in 2008 and bottoming out in 9/2009 at a staggering $1.8T rate. From there, as TARP and other bailout related spending slowed down, we have seen gradual year over year improvement and are currently sitting on a $1.1T TTM rate. The rate of improvement seems to have slowed down, though it will take a few more months to see if this is truly a trend.
     And that is where we are right now….running approximately a $1.1T annual deficit. Going forward, assuming the status quo, we can probably expect costs to continue creeping up, driven by entitlements and interest payments. We can also probably expect revenue to continue to increase at a roughly similar rate, leaving us with a structural deficit of somewhere around $0.9-1.1T. On the table with the fiscal cliff is roughly $100B in spending cuts and $400B in tax increases…though I don’t think anyone expects much of this to actually stand…but even if it did, it wouldn’t come close to closing the gap. In short, the situation looks pretty hopeless, which is why I am nearly certain, one way or another, the US will default on much, if not all of it’s debt and other obligations/promises some time in the future. When?? It is impossible to predict. Probably not in the next 6 months….though with the debt ceiling just a month or so off, it is possible…. On the other hand, at this rate, in 18 years (2030), we are at $36T…a fairly preposterous number. So anywhere between now and then is my guess. 🙂