As fun as tracking the day to day and month to month is…it’s important to take a step back and look at the bigger picture…so here we go…comparing 4 months of 2013 to 4 months of 2014.
Revenues:
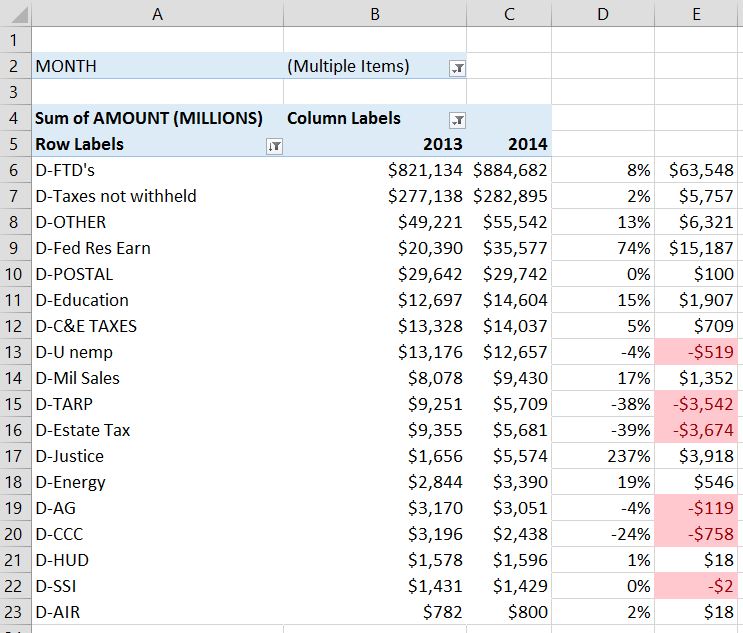
Through 4 months 2013 had pulled in 1.002T of cash revenues, 2014 is almost 9% higher at $1.089T. Curiously, this was running closer to +14% through March before April’s sub 2% growth knocked the average down below 10%. The table below shows most of the major revenue sources from the DTS 2013 vs. 2014 through 4 months.
FTD’s (Federal Tax Deposits)…the primary source of revenues are up a solid 8% and $64B. This is taxes withheld, corporate taxes, excise taxes, and a few other categories lumped together. the only other category that really jumps out is Federal Reserve Earnings…up 74%, and now averaging about $9B per month. Of course…Federal Reserve Earnings is the money left over after the fed first counterfeits “creates” money and uses it to purchase interest bearing assets like treasury notes and mortgage backed securities. Remember, essentially what is happening is that treasury is borrowing money from the Fed. Then, they cut an interest check to the Federal reserve, who uses some of it to pay their accounting staff, and then sends the rest back to treasury as “earnings”. It’s a good deal if you can get it I guess.
So through 4 months, revenues look pretty solid….though the drop in April to below 2% is worth watching. If we see May/June FTD’s jump back up to 8% and stay there…we are probably in for another good year. If, however they dip to the 2-3% range….watch out….
Outlays
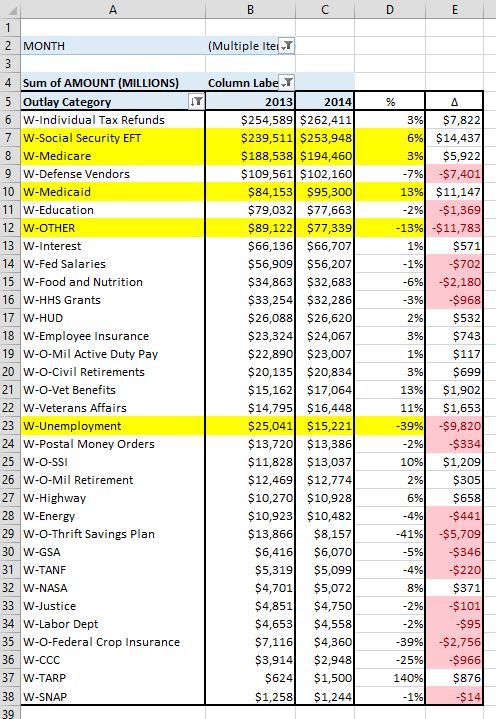
Through 4 months Outlays are down $4B from $1.240T in 2013 to $1.236T in 2014…so essentially flat, which has more or less been the case for about 4 years now at or around a $3.8T annual rate. What has been going on is that while SS/Medicare/Medicaid have continued their steady march upwards, other categories like defense spending, unemployment, and “Other” have been declining in lock step…more or less keeping outlays flat overall. I don’t expect this to keep up for too much longer. At some point…without a major initiative to cut costs, all of those programs that have seen cuts are going to bottom out and resume growing at 2-3% per year….I think we will see this by year end if not sooner.
The table below shows most of the major outlay categories from the DTS comparing 4 months of 2013 to 4 months of 2014:
As expected, SS/Medicare/Medicaid are up….about $31.5B….annualized that’s just shy of $100B of spending per year, and with 2013 outlays coming off of sequestration suppressed # in the second half of the year….I just don’t see us staying negative YOY for much longer. Don’t get me wrong…we aren’t going to tear it up…but we will nudge into positive territory.
Deficit:
And so on solid revenues and flat outlays, the 2014 deficit through 4 months stands at $147B, a $91B improvement over 2013…so far. Where do we go from here? Unfortunately, I’m almost as clueless as I was at the beginning of the year with the same problem. I have a pretty good idea where outlays are headed, but revenue…not so much. If I had to, I’d guess revenues at +6% +/- 5%…good for $320B worth of annualized uncertainty. If that midpoint pencils out, we end 2014 with about a $400B deficit compared to 2013’s $660B. As always…stay tuned.

