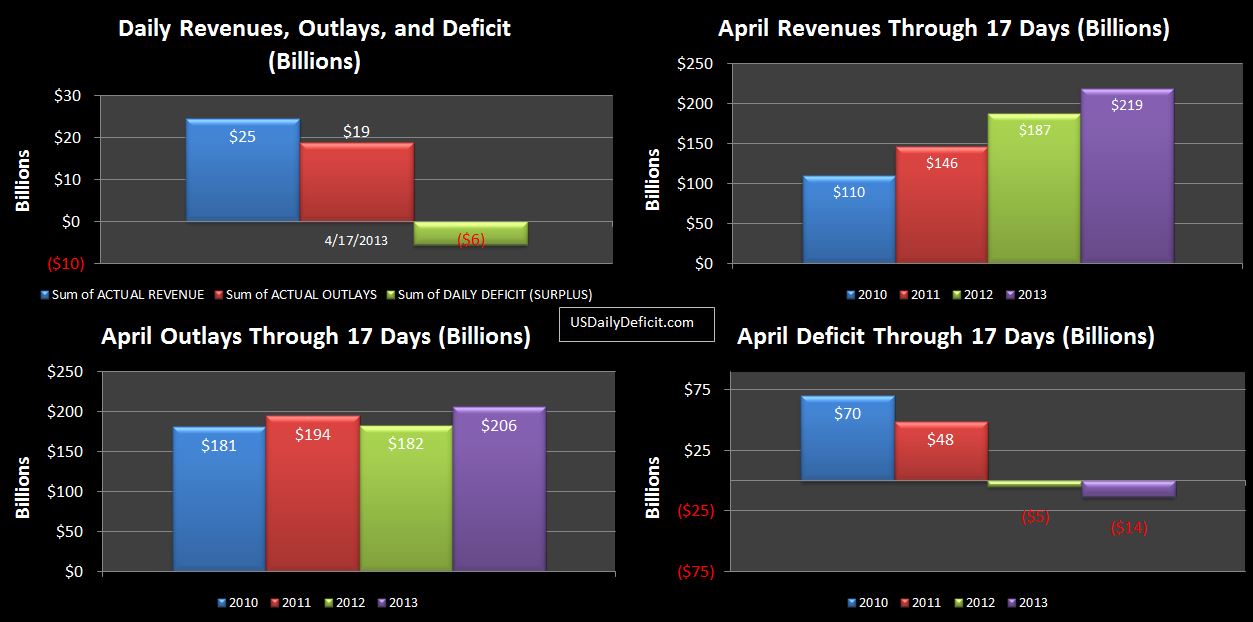
The US Daily Surplus for 4/17/2013 was $5.6B bringing the April 2013 surplus through 17 days to $14B, now $9B better than 2012. Revenues continue to outpace 2012 by a large margin, and are now showing a 17% YOY improvement for April. Outlays, adjusted for timing do appear to be down a little, which we would expect given the ongoing “sequester”.
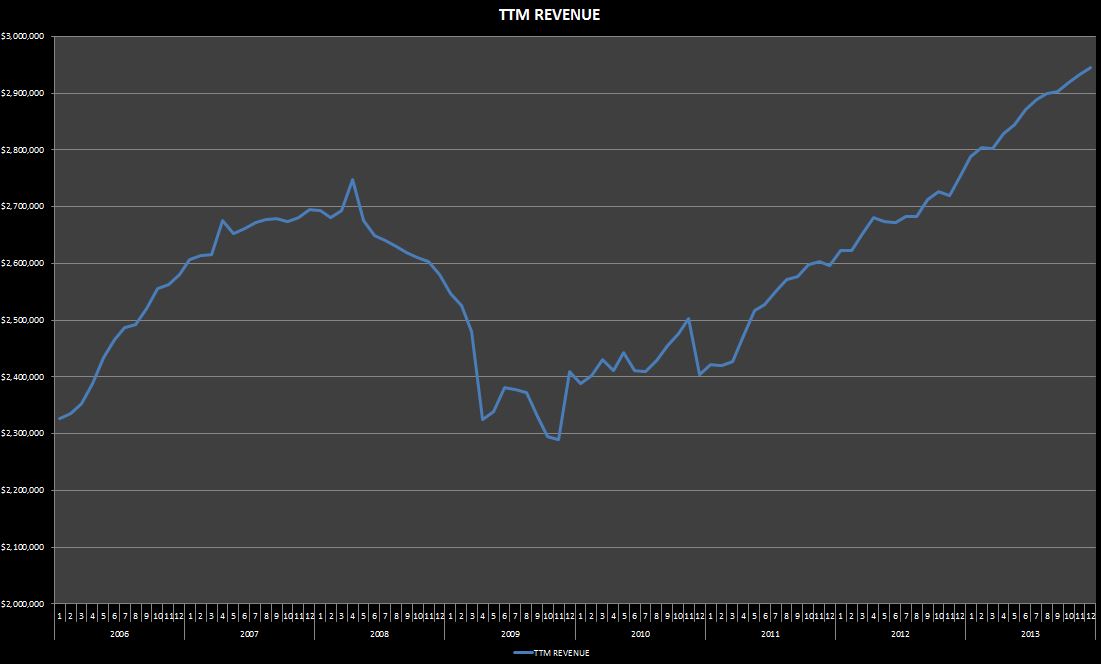
It now appears likely that 4/2013 will exceed last April’s $59B surplus and become the largest surplus recorded since 4/2008, when we posted a $188B surplus….Of course I think we all remember how that ended up…just a few months later, the deficit started to explode as revenues started falling and outlays started ballooning into the “great recession”. I’m not predicting that, but given the news cycle and the recent stock market nose dives, I don’t think it would shock anybody. I just thought it was a little eery…here’s the revenue chart for 2006-2013 trailing twelve month cash revenues.