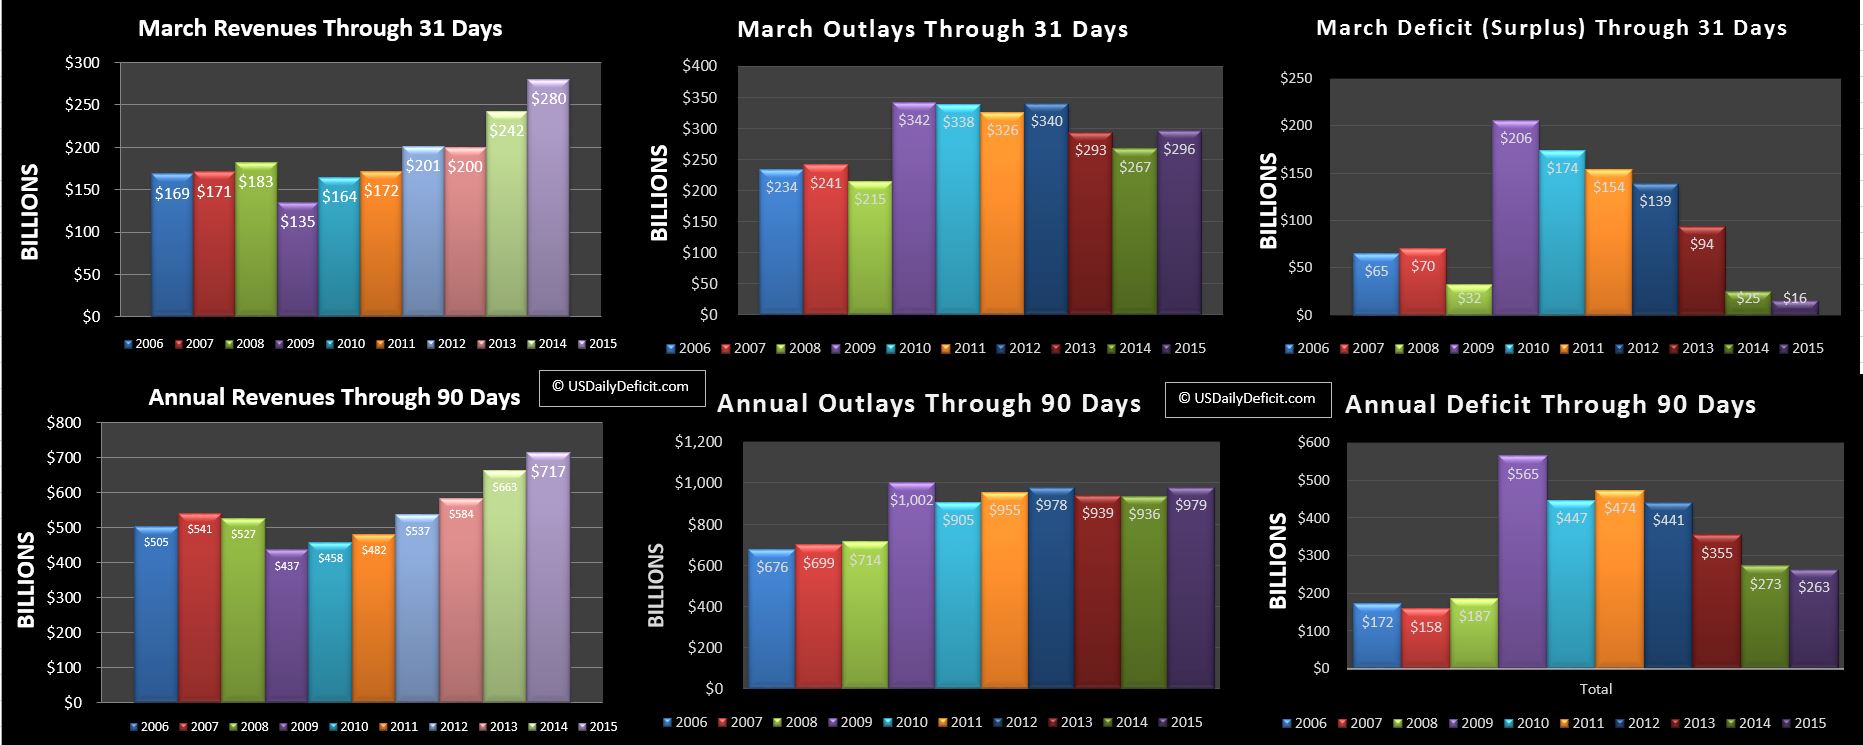
The United States Cash Deficit for March 2015 came in at $16B compared to March 2014 which came in at $25B using the same methodology. Do recall I had to adjust the math this month due to “Extraordinary Measures”(EM). This methodology attempts to isolate EM, but also ignores discounts and premiums on newly issued debt. Using our standard methodology, March 2014 had a $31B deficit, so $6B higher. Once EM is over…in 6-12 months (hopefully sooner) , I will be able to true up the true cash deficit over this time period, but for now, this will have to do.
REVENUE:
Revenue started out as the big story of the month as we kicked off March with $35B of additional revenue from the FCC spectrum auction. Sure enough, March 2015 ended up with revenue $38B higher than 2014, but that’s not the whole story. Offsetting this windfall, GSE dividends (Fannie/Freddie) were down big from $17.6B last March to just $2.8B this March. This is the lowest I’ve observed, with December 2011 at $4.3B being the next lowest, and June 2013 the highest at $66.3B…one has to wonder….will this revenue source completely dry up, and maybe even go negative over the next year? Nah…. Other than that, we had bonafide revenue growth where it counts…withheld taxes (up 6.8%) and corporate taxes(up 12.9%) , giving us a solid baseline at ~+8% for the month, though the extra day certainly helped that a bit. For the year, this baseline is a bit under 5%…good, but not as good as years past.
Outlays:
Outlays were up a fairly big amount for the month at +11% and $29B. $6B of that was expected interest timing. The rest can be mainly attributed to our big 3…Medicare, Medicaid, and Social Security, up $14.5B between them, up 12%. The rest was scattered over multiple categories. This puts us at +4.5% for the year, and while granted our methodology is a little different than last month when we were pretty much flat, this is not a good development through 3 full months of 2015.
Deficit:
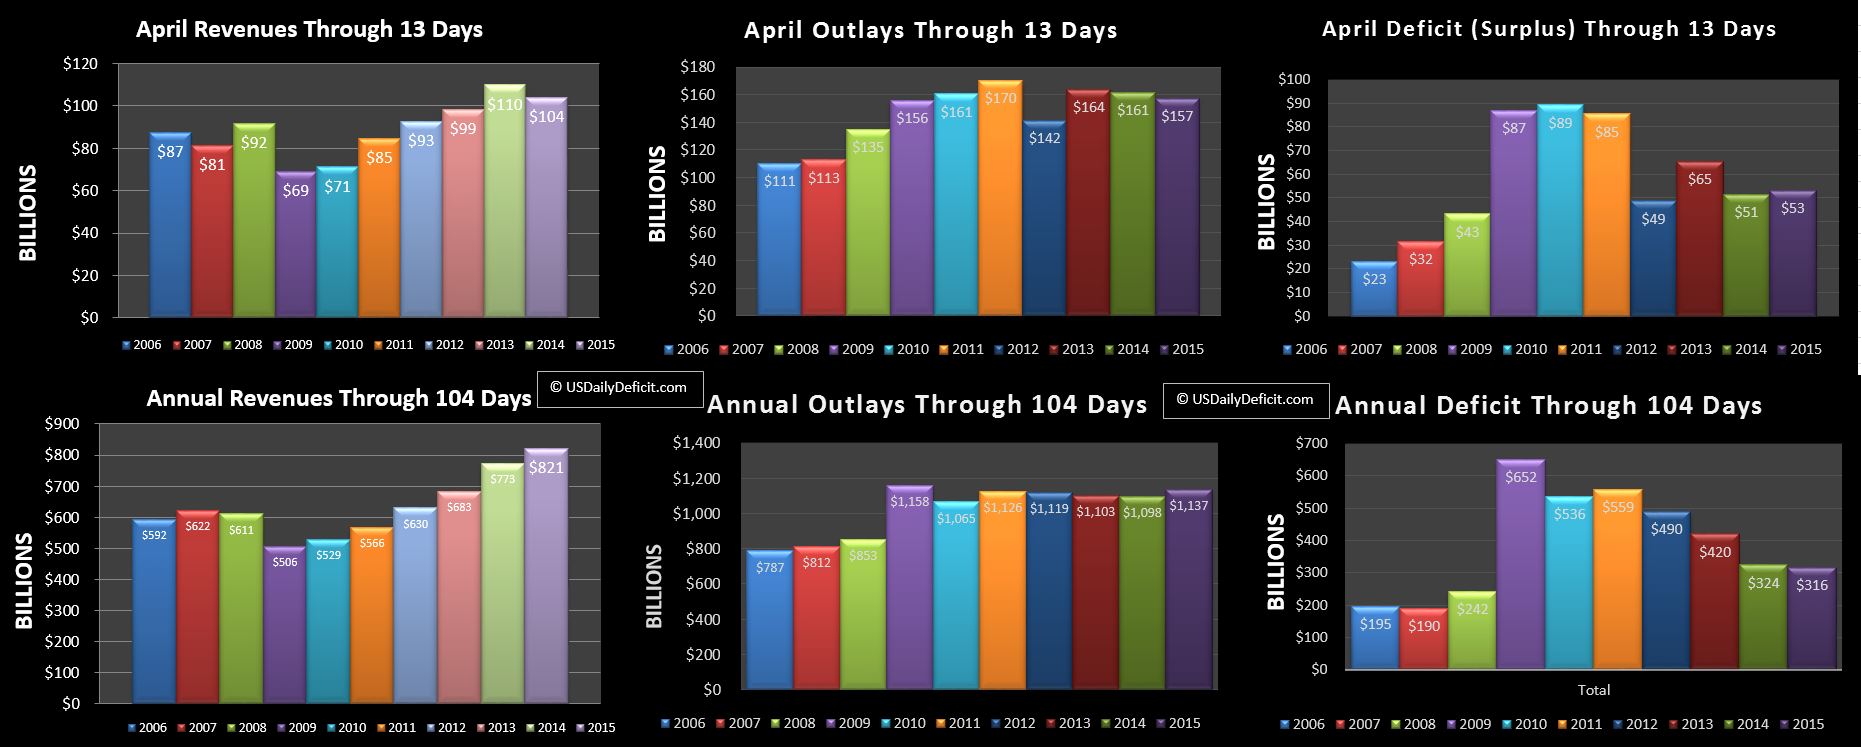
For the Year, the deficit stands at $263B…$10B under last year. That’s not impressive but it is improvement, so of course we’ll take it.
Refunds:
Refunds are a big part of February and March cash flows, and there was some thought that Obamacare would spoil tax refund season for those who had conveniently underestimated income to recieve bigger subsidies. That may be the case, but 2014/2015 individual refunds are just about tied with last year both YTD and for the month. 2015 YTD is at $198.8B…2014 was at $198.4B. Business tax refunds have nearly doubled from $12B to $21B on the year, but are still way under 2010’s $42B through 3 months.
Forecast:
March was not my best showing…I guess I let my optimism 🙂 get the best of me forecasting a $5B surplus, but marginally lower revenues and higher outlays sunk me, leaving me with a $21B miss to follow February’s $1B miss. Oh well…my average is still around $10B. Moving forward, April is notoriously unpredictable. Last April, I missed by $55B….optimistically predicting a $180B surplus vs. an actual surplus of $125B. So…fully aware this may be a swing and a miss, I’m going to assume we get ~8% revenue growth in both withheld and not withheld taxes, while outlays are up ~3% overall. Pencil that out, and I’m down for a $155B surplus for the month of April.
Summary:
It was another good month, even if most of that was due to the spectrum auction. I know everyone is talking about popping bubbles and doom and gloom, but for the time being, government revenues continue to grow at a fairly steady pace. Granted, things can change quickly, but as of the end of March we are still pushing forward with 5+ years of fairly impressive revenue growth. When/If things go south, I should see it in real time (not saying this is a leading indicator…just saying we’ll see it).
Sit back and enjoy the show!!