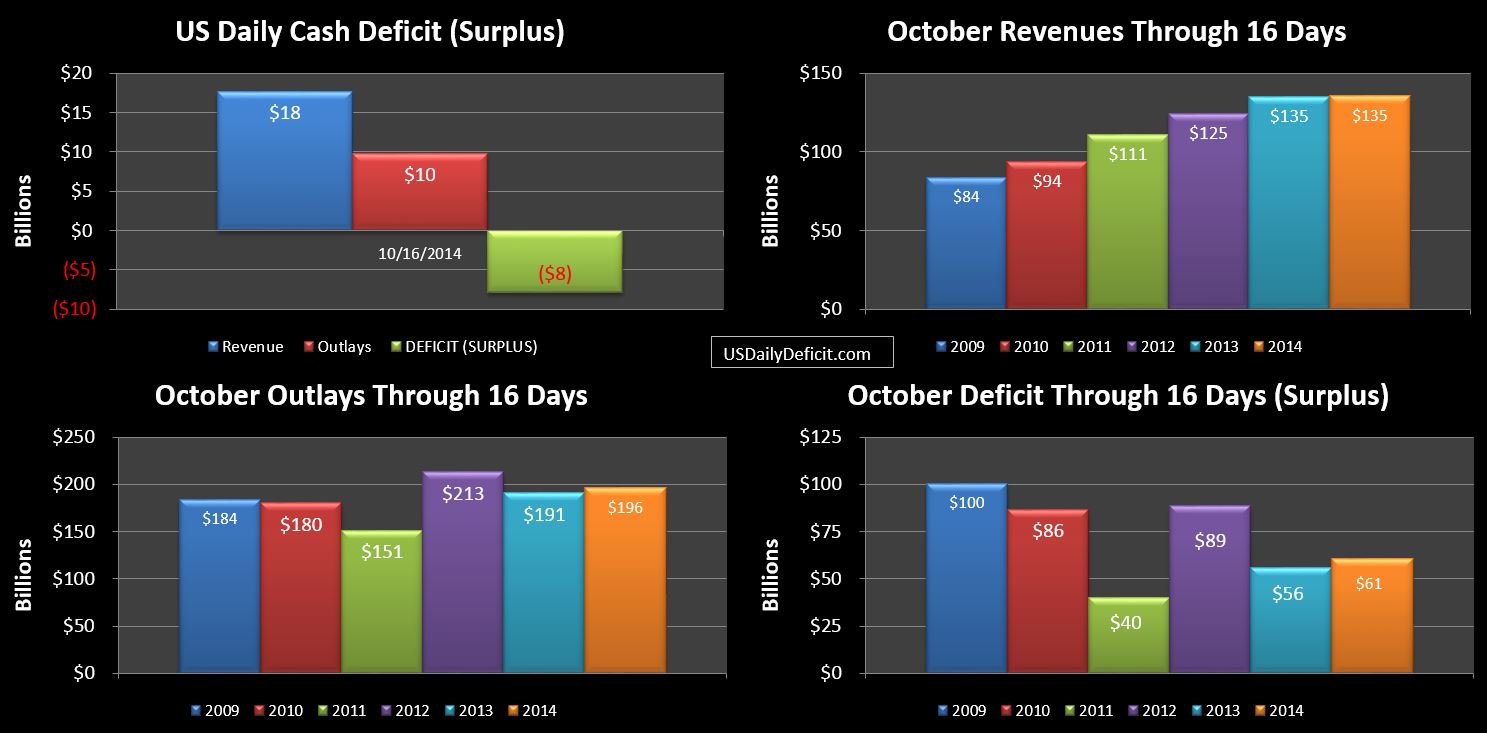
The US Daily Cash Surplus for Monday 10/20/2014 was $15.2B bringing the October 2014 deficit through 20 days back down to $48B. There was a surprise for the day…an $8.2B remittance from Justice. I’ve long since lost track of all of the banking fines, but I’d have to assume this is one of the latest. It’s an $8B pickup….that’s definitely going to help the month. Just for reference, last Octobers total revenues were $223B, so if everything else ended up exactly equal, just this one item gets us up to almost +4%….so we can all breathe a sigh of relief…well at least until next October when we come up $8B short, but these are good problems to have….we’ll take it.
Now…on to our charts….
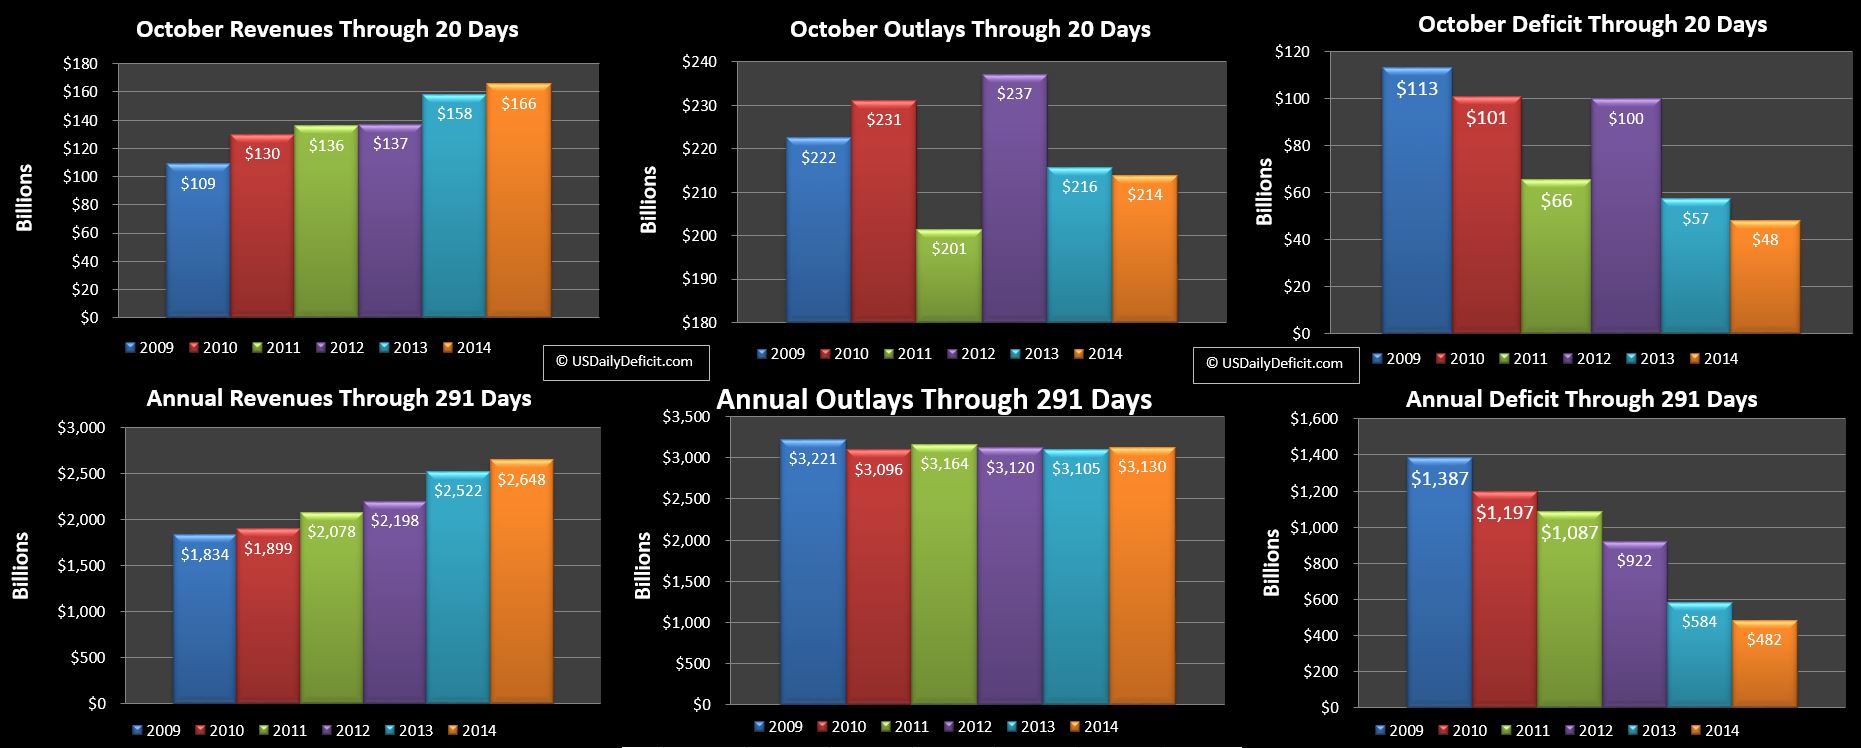
Big changes….what do you think? I’m not committed to it yet…just trying it out. I do fully realize that charts that look great on my 27″ monitor might not look so great on your old razor flip phone, so feel free to email me for an informal survey. I can’t promise I’ll change anything, but I am interested in feedback. My recommendation would be to click on the chart for a much better view than what you get embedded in the post.
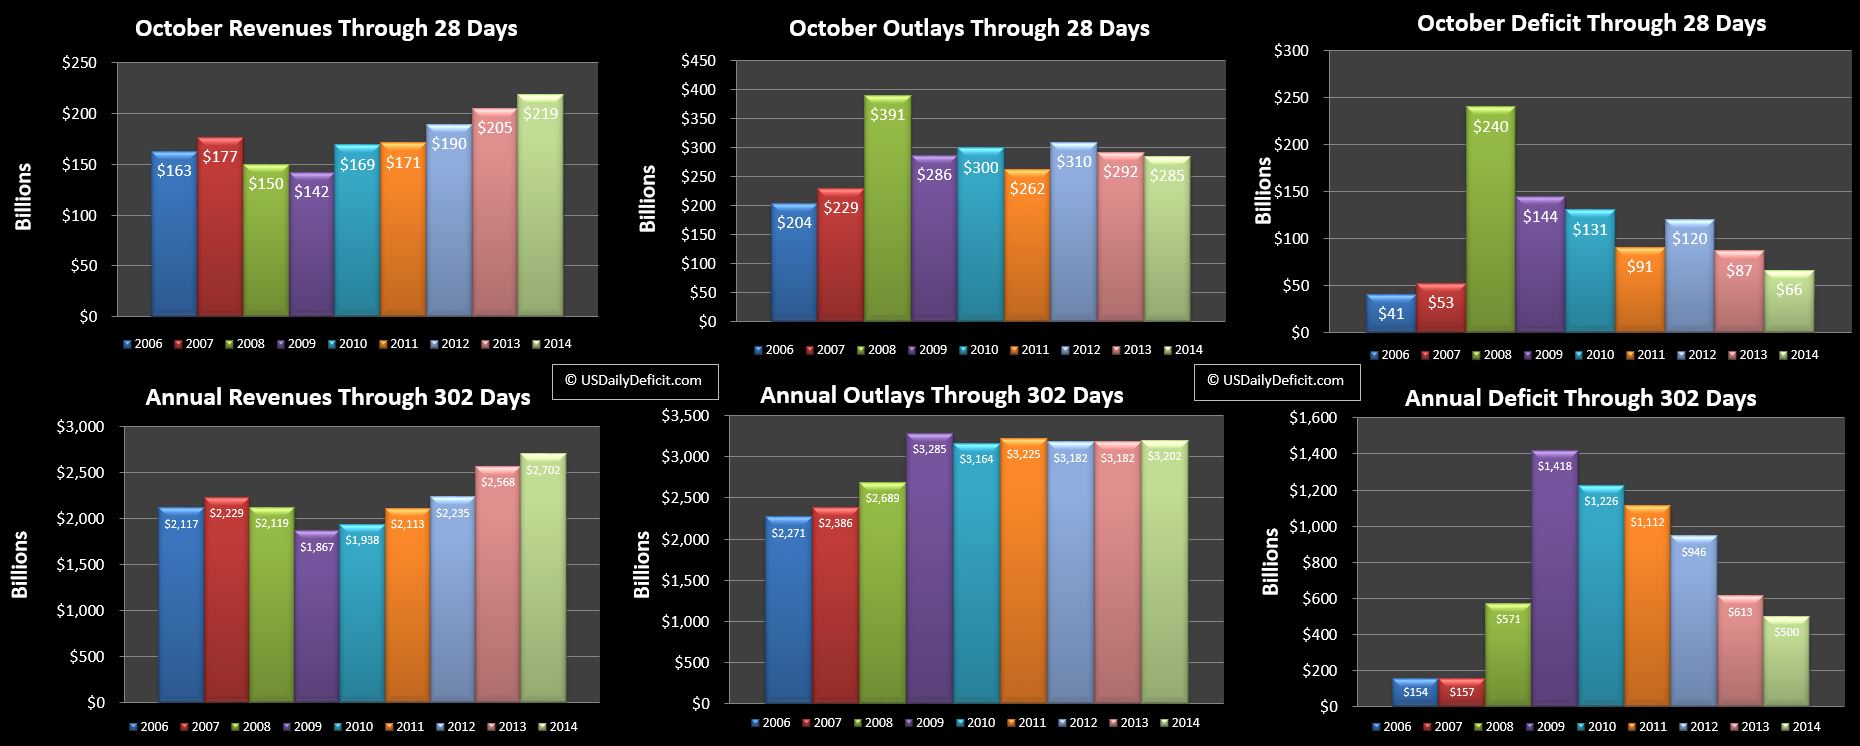
So, as much fun as tracking the daily and monthly deficit is, the truth is that what really matters is the YOY. I’ve been tracking this on the side since the beginning and updating periodically, but have decided to add charts for the YTD Revenue/Outlays/Deficit. Remaining are the MTD charts, but gone is the namesake daily deficit :(.
Finally, some changes in methodology. My original methodology was quite simple. From the DTS, we took took total deposits and total outlays, and adjusted for tax refunds (which I view as negative revenue rather than outlays) and debt issuance/repayment. This makes sense to me…issuing say $200B of debt (and increasing cash $200B) has no affect on the deficit….until I spend it….you know a few days later.
However, there was just one problem….debt outstanding seemed to be increasing faster than my math would suggest. While it fluctuated, the average was a little over 4B per month…$50B per year. It’s not a huge number in relation to the 3.8T annual outlays, but at heart, I’m an accountant, and it bugs the crap out of me when numbers don’t tie. So I started digging and the conclusion i have come to is that this amount is primarily related to amortized interest and how it is accounted for on the DTS.
For example, when you generally think of a a US bond, you probably think ok…I’ll lend ol’ Uncle Sam $100, he will pay me lets say 3% interest for the next 30 years, then in 30 years I’m sure he’ll borrow money from some other sap and give me back my severely depreciated $100…with which I’ll go get a package of go-go squeeze or something. However, what if prevailing rates are at 3.5%. What will happen is that to essentially balance it out, the price of the bond will come down a bit to bump up the effective yield to prevailing. For most of you…this isn’t a new concept, but for the record….this little thing creates a 30 year pain in the ass for the accounting crew….well at least it does for public companies.
Say that the price of the bond comes down to $98. You show up, give Uncle Sam $98, and he gives you a $100 bond. When you check the DTS later that afternoon, you will see cash in from “Public Debt Cash Issues” at $98, but debt outstanding will have increased by $100. So…what to do with the $2 difference. Well…for your financial reporting you probably whip up a whiz bang spreadsheet and figure out how to recognize that $2 as interest expense over the next 30 years….hence the pain in the ass. But the DTS is a cash flow statement. What I incorrectly assumed several years back when I kicked off this project was that when that $100 came due, they would list it as “Public Debt Cash Redemption $98, and interest expense $2…thus bringing everything back into balance. WRONG!!! What they actually do is just book the $100 to “Public Cash Debt Redemption”…which i suppose is fine, but due to the way I was calculating the deficit caused me to permanently miss capturing amortized interest to the tune of ~$50B per year. Doh!!
So the new methodology fixes that by recognizing amortized interest as an outlay upon issuance. It’s not perfect, but it’s better than how I was handling it, and over time it should more or less even out.
Looking back…this change in methodolgy pushes the 2013 deficit up from the $660B I initially reported to $704B. For 2014, As of September the YTD deficit I reported was $388B. Now I have it at $434B…$46B higher. Looking at September only, I previously reported a $63B Surplus…now i have it at $57B.
So…there you have it…a lot of changes, and I don’t even have time to review the charts. I’ll give some commentary on the charts tomorrow after we get the Tuesday DTS….and I have time to field all of the complaints about the new charts 🙂 Enjoy!!