Monthly Archives

May 2014

May 2014 Cash Deficit Forecast

By | Daily Deficit

So…admittedly…my April forecast was a bust….my projection of a $180B surplus was $55B too optimistic as I overestimated revenues and underestimated tax refunds.

But now it’s time to get back on the horse. May is typically a high deficit month as Revenues fall off a cliff and a big chunk of interest payments go out. Last year, for all of April 2013’s glory at a $117B surplus…May 2013 came along and completely wiped it out with a $159B deficit.

My guess for May is going to be $133B deficit. I have revenue gains at only 6%….I have adjusted down a bit due to the weakness we saw in April, and some unfavorable timing for May 2014…primarily one less business day. Outlays I actually have down 3% primarily due to a spike in “other” last May well above the average I’ve been using in my forecast. This category is fairly volatile, so I’m not sure if that spike was something seasonal that will repeat itself or if it was a one time hit, but I’ll stick with the more conservative number for now.

April 2014 YTD Update

By | Daily Deficit

As fun as tracking the day to day and month to month is…it’s important to take a step back and look at the bigger picture…so here we go…comparing 4 months of 2013 to 4 months of 2014.

Revenues:

Through 4 months 2013 had pulled in 1.002T of cash revenues, 2014 is almost 9% higher at $1.089T. Curiously, this was running closer to +14% through March before April’s sub 2% growth knocked the average down below 10%. The table below shows most of the major revenue sources from the DTS 2013 vs. 2014 through 4 months.

2014-05-05 April ITD Revenues

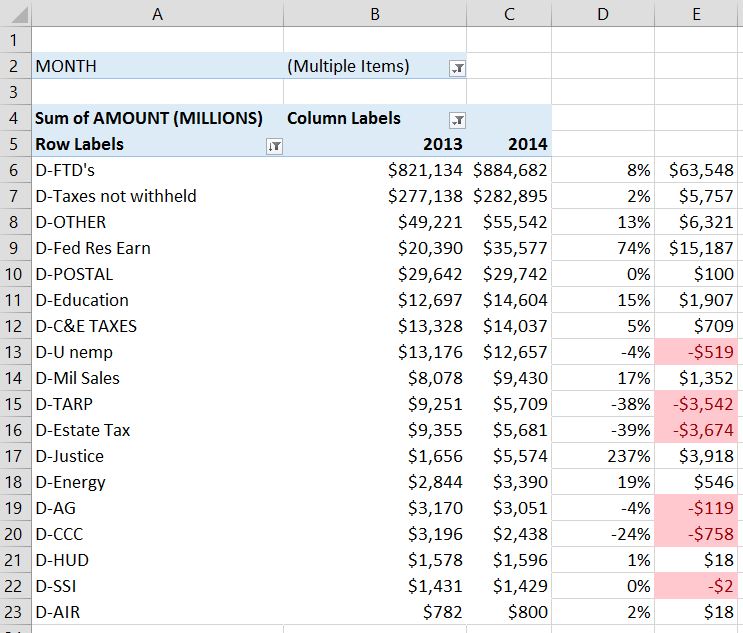
FTD’s (Federal Tax Deposits)…the primary source of revenues are up a solid 8% and $64B. This is taxes withheld, corporate taxes, excise taxes, and a few other categories lumped together.  the only other category that really jumps out is Federal Reserve Earnings…up 74%, and now averaging about $9B per month. Of course…Federal Reserve Earnings is the money left over after the fed first counterfeits “creates” money and uses it to purchase interest bearing assets like treasury notes and mortgage backed securities. Remember, essentially what is happening is that treasury is borrowing money from the Fed. Then, they cut an interest check to the Federal reserve, who uses some of it to pay their accounting staff, and then sends the rest back to treasury as “earnings”. It’s a good deal if you can get it I guess.

So through 4 months, revenues look pretty solid….though the drop in April to below 2% is worth watching. If we see May/June FTD’s jump back up to 8% and stay there…we are probably in for another good year. If, however they dip to the 2-3% range….watch out….

Outlays

Through 4 months Outlays are down $4B from $1.240T in 2013 to $1.236T in 2014…so essentially flat, which has more or less been the case for about 4 years now at or around a $3.8T annual rate. What has been going on is that while SS/Medicare/Medicaid have continued their steady march upwards, other categories like defense spending, unemployment, and “Other” have been declining in lock step…more or less keeping outlays flat overall. I don’t expect this to keep up for too much longer. At some point…without a major initiative to cut costs, all of those programs that have seen cuts are going to bottom out and resume growing at 2-3% per year….I think we will see this by year end if not sooner.

The table below shows most of the major outlay categories from the DTS comparing 4 months of 2013 to 4 months of 2014:

2014-05-05 April ITD Outlays

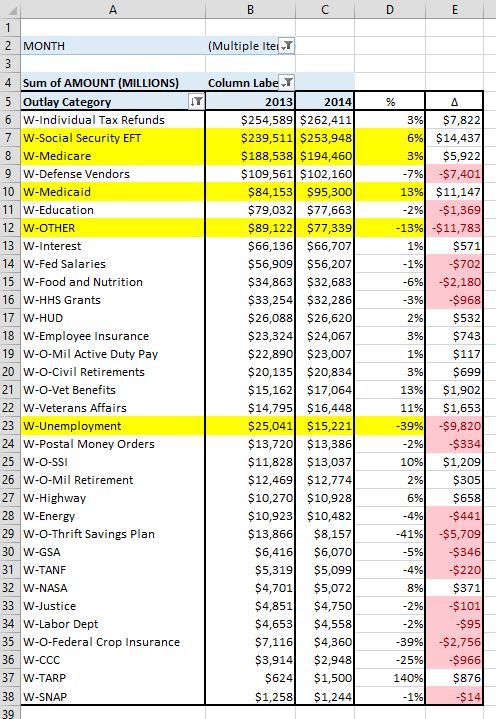
As expected, SS/Medicare/Medicaid are up….about $31.5B….annualized that’s just shy of $100B of spending per year, and with 2013 outlays coming off of sequestration suppressed # in the second half of the year….I just don’t see us staying negative YOY for much longer. Don’t get me wrong…we aren’t going to tear it up…but we will nudge into positive territory.

Deficit:

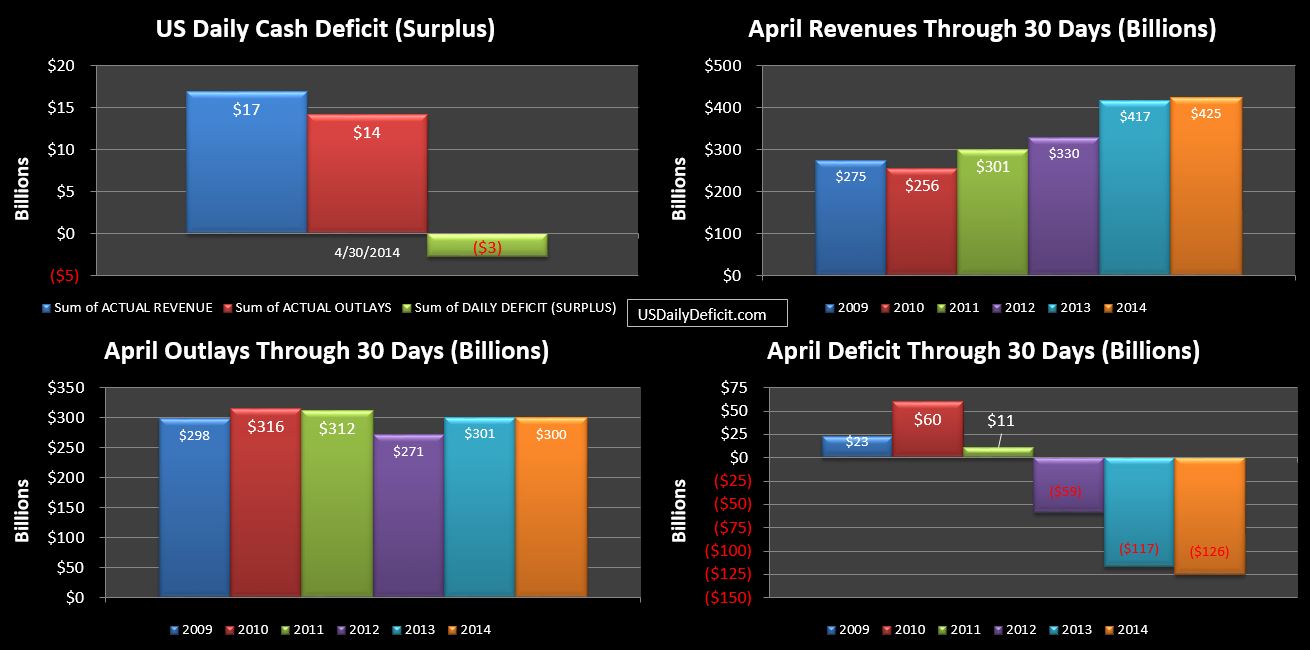
And so on solid revenues and flat outlays, the 2014 deficit through 4 months stands at $147B, a $91B improvement over 2013…so far. Where do we go from here? Unfortunately, I’m almost as clueless as I was at the beginning of the year with the same problem. I have a pretty good idea where outlays are headed, but revenue…not so much. If I had to, I’d guess revenues at +6% +/- 5%…good for $320B worth of annualized uncertainty.  If that midpoint pencils out, we end 2014 with about a $400B deficit compared to 2013’s $660B. As always…stay tuned.


US Daily Cash Deficit April 2014

By | Daily Deficit

The US Daily Cash Surplus for Wednesday 4/30/2014 was $2.8B bringing the US Cash Surplus for April 2014 to $125.5B…topping last April’s pretty phenomenal surplus by almost $9B.

2014-04-30 USDD

And yet….It is quite clear that my initial forecast of a $180B Surplus for the month was a bust….a $55B miss…my worst guess ever, topping my $18B miss back in November by a factor of 3. There goes my average….:) So plain and simple I missed the revenue big time. I figured the +10% we’d been seeing would continue…ignoring numerous posts of mine from last year stating the obvious…building on last April’s 27% YOY gain was going to be a mathematical challenge…and so we ended up at +1.9%. Not helping my cause…refunds actually picked up a bit. But Outlays…I nailed…”down a smidge” I said…and sure enough…down 0.3%…a $1B decrease.

So obviously….we would have preferred a $180B surplus…but I’m not panicked about this…yet. Now I’m looking to May and June revenues. If they also end up at a paltry 2% revenue growth…..then yes…alarm bells are starting to go off. If, however they jump back up to what we saw from Jan-March….in the +10% or so range….I can write April off as an anomaly…April 2013 was just so high…topping it by 2% is a victory in itself.

There were two things I mentioned a few days ago that I want to follow up on. First was taxes withheld…up 8% between January and March…ended up at only 2.5%. This is more or less where I would expect it to be in a slow growth economy…it will be interesting to see if this is a one month anomaly or if it persists. Again…look to May and June.

Second was Medicaid spending…the only visible piece of Obamacare outlays, which was up 14% YOY through 3 months of 2014. For the month, Medicaid came in at $24.4B…the highest monthly total in nearly 3 years, but only 8% over last April’s $22.5B spend…pulling down the average a bit, but still on an ugly trend line. This series tends to jump around a bit month over month, but through 4 months, +10% growth appears to be in the cards.

So to wrap it up…any month you have a $125B surplus is a good month. Treasury even took the occasion to pay down external debt by about $115B and still end up with a cash balance of $148B. It might be worth noting, however that Intragovernmental debt…that debt we pretend we owe to ourselves as discussed here, crossed $5T yesterday for what looks like the first time ever. So look in your pocket…your personal share of that is about $16k….remember…it’s an asset…and a liability…don’t think too hard about it…you might hurt yourself.