Monthly Archives

April 2014

March 2014 Update: Social Security Enrollment

By | Commentary

In March 2014 the SS rolls added 143k to the headcount bringing the total to 58.341M. This compares to a 138k add last March, breaking a 4 month string of improvement.

2014-04-14 March SS Analysis

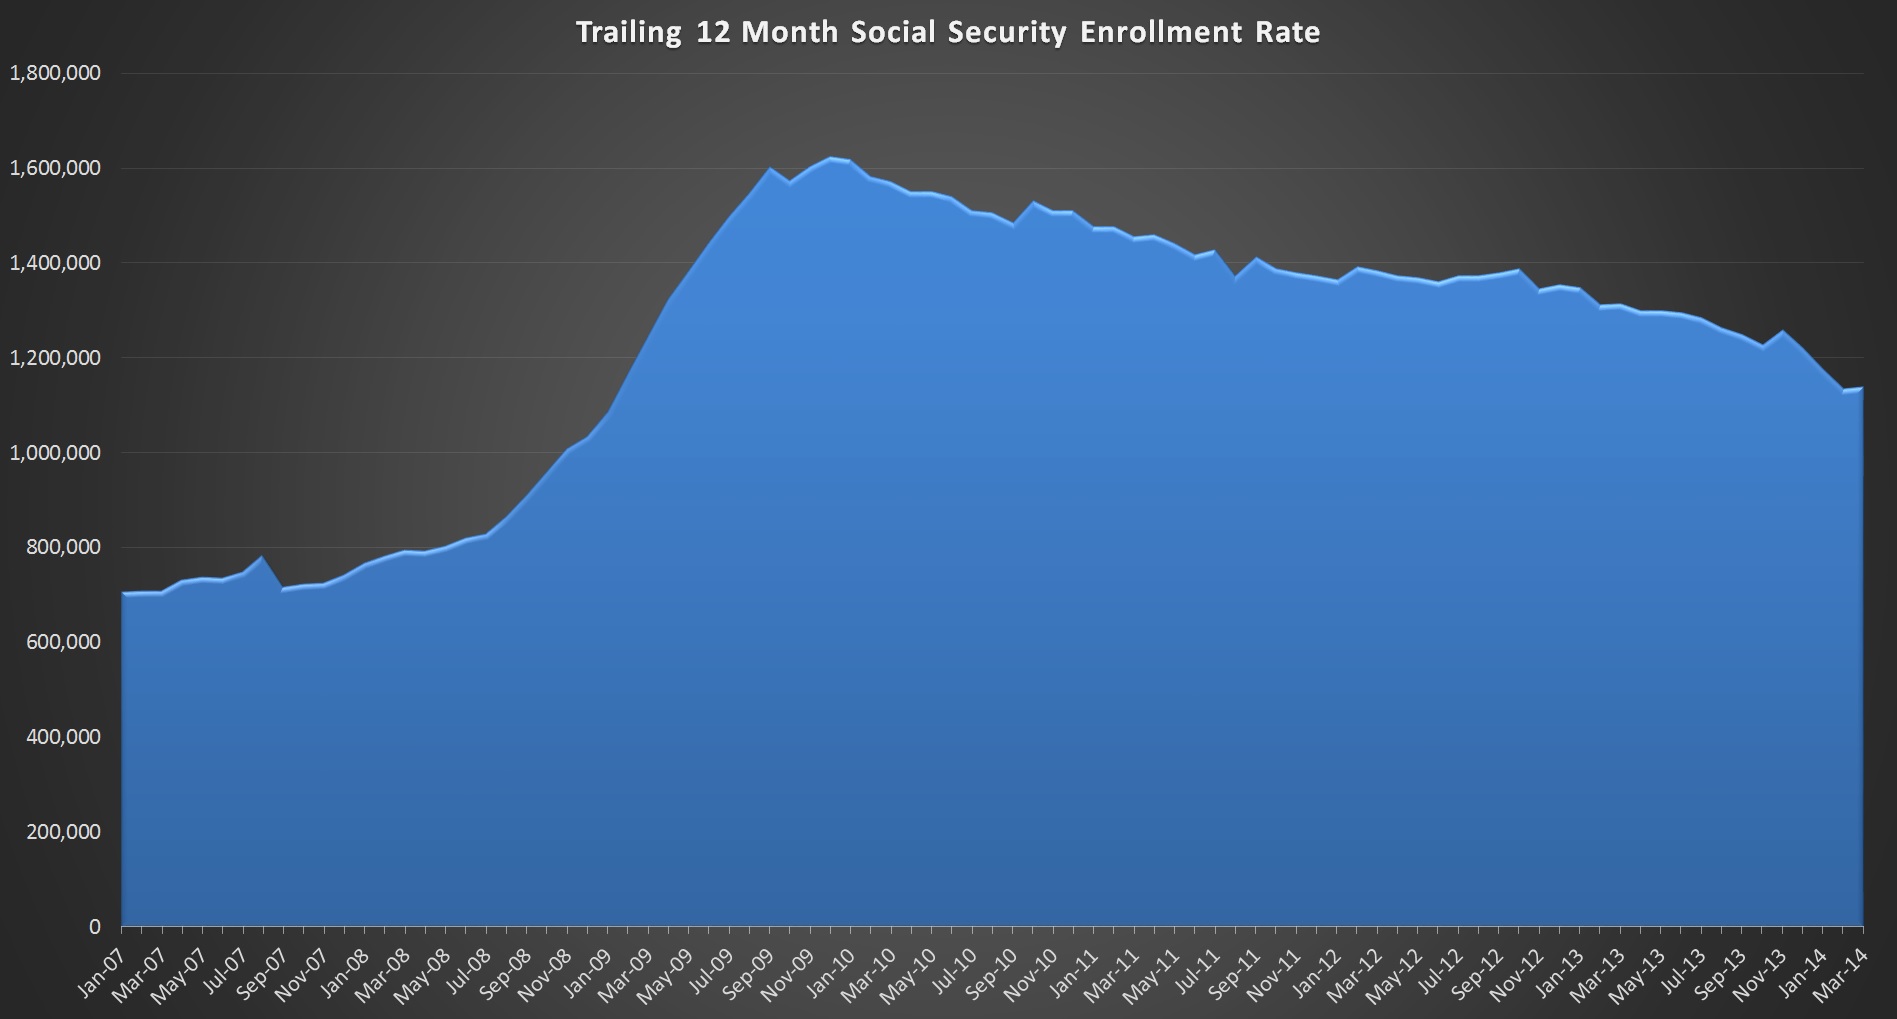
It’s just a one month break in a downward trend dating back to the last peak in December 2009 at 1.6M, so it’s nothing to get excited about either way. The rolls are growing by over 1.1M people per year, and cash outlays are growing at 8% annually, which is a combination of additional people, COLA adjustments, and new retirees coming into the system with higher monthly payments than the people they are replacing.

As I’ve explained before, I monitor this series primarily to look for signs of a new spike similar to what we saw between 2008 and 2009. If this correlated with a decrease in revenues, we would have a pretty clear sign that a recession is either already in progress or imminent. As it stands, we see neither. Revenue is at all time highs and growing at about 12% through the first 100 days of 2014. Retirements…while still high historically, continue to trend down….slowly. It’s clearly too soon to declare that everything is going to be ok, but even I must admit….things have been a lot worse.

US Daily Cash Deficit 4/11/2014

By | Daily Deficit

The US Daily Cash Surplus for Friday 4/11/2014 was $3.6B bringing the April 2014 deficit through 11 days to $70B.

2014-04-11 USDD

Everything is still pretty much tied up between 2014 and 2013. The next week and a half will likely be a bit messy, but we should have a good idea what kind of month we are going to have by next Thursday.

US Daily Cash Deficit 4/10/2014

By | Daily Deficit

The US Daily Cash Deficit for Thursday 4/10/2014 was $3.6B bringing the April 2014 cash deficit to $74B through 10 days.

2014-04-10 USDD

I have decided to “unsync” 2014 and 2013 and go back to a straight calendar day comparison. I typically sync up on days of week because a lot of the cash inflows and outflows are driven by day of week…for example SS payments go out the 2nd, 3rd, and 4th Wednesday of the month(as well as the 3rd of the month). But April is a bit different. Those patterns still exist, but the dominant event of the month is tax day, April 15th, which will bring with it a surge of revenues. As such, proximity to 4/15 will be a large driver, and rather than complicate the issue by adjusting for day of week, from here on out, the charts will be unadjusted. So the charts above compare all years…10 days of April…regardless of day of week.

So…looking at April…2013 and 2014 are pretty much in sync. The forecast for a $180B surplus I made earlier in the month is dependent on a 13% YOY ($56B) increase in revenues. It’s not time to panic….most of that gain…if it happens will likely be seen after 4/15…but it is a bit curious that so far…nothing.

US Daily Cash Deficit 4/9/2014

By | Daily Deficit

The US Daily Cash Deficit for Wednesday 4/9/2014 was $12.1B bringing the April 2014 deficit through 9 days to $70B.

2014-04-09 USDD

No signs of an impending revenue surge yet….we are still pretty much in line with last year after adjusting for business days. It’s kind of hard to believe that we will go from a $70B deficit today to potentially a ~$180B surplus in just a few weeks, but that’s what the tarot cards say…

US Daily Cash Deficit 4/7/2014

By | Daily Deficit

The US Daily Cash Surplus for Monday 4/7/2014 was $5.6B following a $0.5B surplus Friday 4/5/2014, and bringing the April 2014 deficit through 7 days to $56B. 2014-04-07 USDD Through one week, nothing really stands out….this year looks a lot like last year so far. Revenues and outlays appear low on the chart, but that’s mostly due to the extra business day for 2013… Things won’t really get started until 4/15 next Tuesday.