Monthly Archives

January 2014

US Daily Cash Deficit 1/7/2013

By | Daily Deficit

The US Daily Cash Surplus for Tuesday 1/7/2013 was $1.9B…a bit of a surprise since we generally do not see surpluses on Tuesday.  I suppose it’s a bit comical….yesterday I commented on how the cash FTD’s for the day were up only 2.2%…not nearly enough. Today…as if our prayers were answered….cash FTD’s were 6.511B compared to 2.331B last year(1/8/2013)…good for nearly a triple 🙂 Ok…maybe I’ve learned my lesson….unless somebody at Treasury  is reading my blog and screwing with me?? In any case…it was a pretty good day…at this pace we should have the entire debt paid off in no time 🙂

2014-01-07 USDD

On the month…primarily due to our timing adjustments discussed before, withheld tax deposits are down 2%, Taxes not withheld are down 19%, and corporate tax deposits are down 9%. The good news is that Justice pulled in $1.7B today….is that another corporate fine? On the outlays side…thanks to the one less business day that is hurting revenue…outlays are down 15%. All in…this was a good day with a YOY revenue gain of $6B and a $3B decrease in outlays…good for a $9B improvement.

US Daily Cash Deficit 1/6/2014

By | Daily Deficit

The US Daily Cash Surplus for Monday 1/6/2014 was $5.0B bringing the January 2014 deficit through 6 days to $21B.

2014-01-06 USDD

For the day…that is comparing Monday 1/6/2014 to Monday 1/7/2013…revenues were up $1B and outlays were down about $2B. Honestly it’s still too early to tell much of anything, but just for fun I looked at the “Cash Federal Tax Deposits” category on the DTS which makes up 75% of all cash revenues and compared 1/6/2014 to 1/7/2013 thinking that these days should be about as clean cut a YOY comparison as I’m ever going to get. Yesterday came in at $11.824B vs $11.564B last year. ….good for a 2.2% increase…not much better than the increase in employment at 1.7% per my math. What does it mean?? Nothing yet…it’s one day out of ~250 or so. However, this is a key revenue stream I will be tracking in 2014. In total, the CBO is expecting FY 2014 revenues to be nearly +10% (they don’t forecast calendar years)…so we had better all hope this 2% is just a fluke.

US Daily Cash Deficit 1/3/2014

By | Daily Deficit

Hello 2014!! The US Daily Cash Deficit for Friday 1/3/2014 was $26.5B…less a $0.2B surplus on 1/2/2014 leaves us with a $26B deficit for January with 3 days under our belt.  Don’t fret though…January is likely to be a light deficit month thanks to January tax payments flowing in…I hesitate to guess because I have a high degree of uncertainty about YOY revenues…it is probably going to take a month or two to re-calibrate expectations. If we assume revenues gain ~5-7% and outlays only grow at a 2% rate….a $25B deficit for the month looks about right. If, however we see revenues collapse…or spike…this could end up being a huge miss.

2014-01-03 USDD

Above are the charts…now honestly it’s too early in the month to really start looking at the YOY….mainly I want to discuss timing and the adjustments I will make to sync up 2013 and 2014 for the rest of the month. Recall…different revenue and outlay streams are driven by different variables. Social Security, for example is paid out in 4 big chunks with one being on the 3rd of the month, and the remaining 3 being on the 2nd-4th Wednesdays of the month. Some, on the other hand are driven simply by business days…being more or less flat throughout the month. While there is no perfect way to do it, I prefer to sync up on days of the week, which usually syncs up Social Security as well as tax deposits, which seem to be strongest on Mondays, followed by Wednesday and Friday which have moderate revenues, while Tuesday and Thursday are generally weak.

So…for January, I will be syncing up by adding one day to 2013…thus the chart above compares January 2014 Thursday 1/2 and Friday 1/3 to January 2013’s Wednesday 1/2 through Friday 1/4…This pattern will continue for most of the month….so tomorrow I will add Monday 1/6/2014 and Monday 1/7/2013. Now the obvious flaw for now is that 2013 has an extra business day…and thus higher revenues and outlays. This should work its way out over the course of the month…just remember that on revenues…we are starting at -$9B…this early in the month…don’t be too concerned about the number itself…but which direction it is heading.

US Daily Cash Deficit 12/31/2013

By | Daily Deficit

The US Daily Cash Surplus for 12/31/2013 was $21.4B pushing the December 2013 surplus to $54B, and the 2013 full year cash deficit to $660B. As expected, revenues were strong led by $39B of GSE dividends…including the $25B related to Fannie’s pretend tax assets. Outlays were also strong as $6B of interest was due and a slew of payments that typically go out on the first of the month were pulled into December with 1/1 being a holiday…..of course this happens every year, so it doesn’t really cause a timing variance.

12-31-2013 USDD

I’ll have a more detailed 2013 post up in a week or so, but the bottom line is that 2013 was an impressive year, with revenues up 14% and outlays down 1%…good for a $436B improvement from $1.096T in 2012 down to $660B in 2013…the first sub $1T deficit since 2008.


December 2013 Update: Social Security Enrollment

By | Commentary

Just a refresher to start off…the Social Security Program covers nearly 58M people with an average monthly benefit of $1184 per month based on my calculations. Of the 58M, 38M are retired workers, 9M are disabled workers, and the rest are generally spouses and children eligible for some form of derivative benefit.

The recently released December numbers show additions of 62k people, 57k of which was the retired worker program, with most of the other categories more or less netting to zero. Compare this to last December, when 59k were added to the retired 99k were added in total. So retired workers are more or less flat, but still running at a 1.172M pace not far off the 1.240M record set back in 12/2009.

In the remaining categories, the biggest story is that the disabled worker category, for all of the headlines about record levels, only added 924 people for the month, though obviously setting a new record. The annual growth rate is now down to +115k, down to about a quarter of the record 416k pace set back in  11/2010. Now granted, it’s definitely not a good thing that we have nearly 9M disabled workers, but at least for the time being, the growth rate has dropped from 5% to 1%….a small victory, but we’ll take it. More or less, it seems that aside from retired workers, the rest of the SS population has stabilized…for now.

Retired Workers TTM Growth:

2014-01-31 Social Security Workers TTM Delta

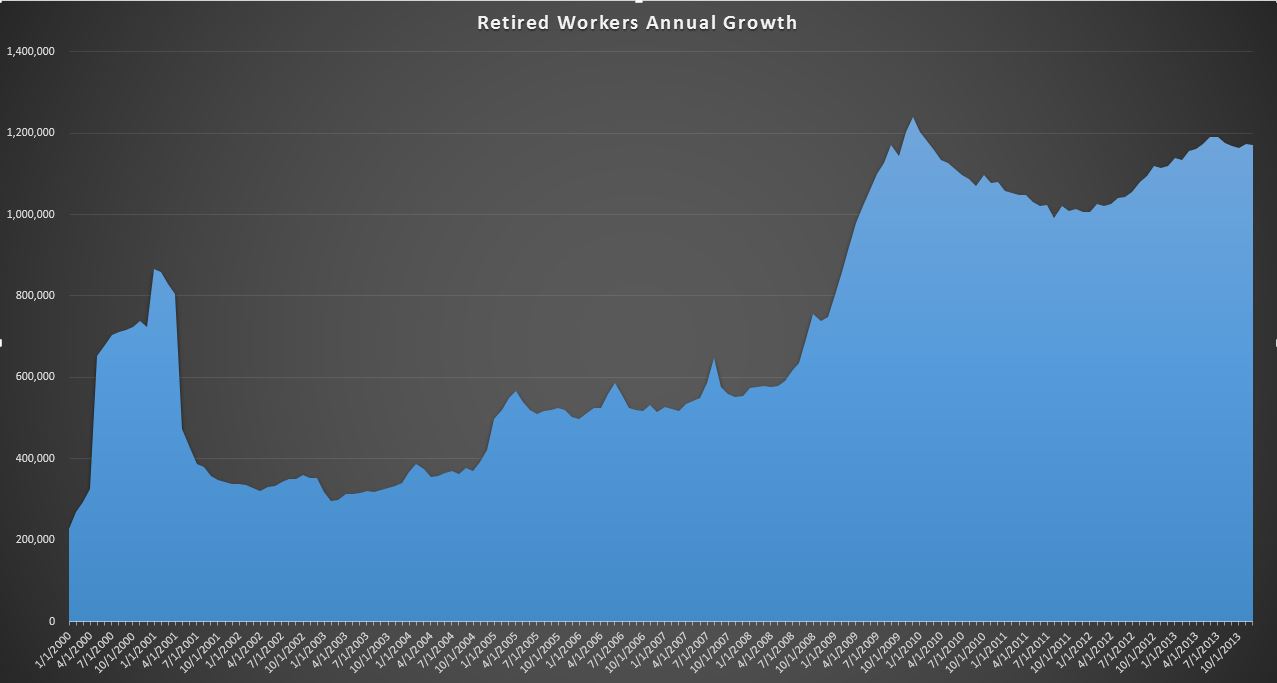
You will probably want to click on this chart to make it bigger, but it shows the annual rate of change in retired workers starting in 2000 when the rate was 227k all the way through December 2013. The primary reason I track this data series is because we all hear that there is a huge wave of boomers that will be retiring over the next 10 years or so. We are already adding enrollees at a very high rate…I want to see when/if the rate starts growing and I think this chart will be the alarm. Since this is the largest piece of spending in the federal budget, understanding growth in this program is critical to forecasting future outlays. For now, we remain on a high plateau adding nearly 1.2M people per year with no noticeable change in December.

Looking ahead, it turns out that a lot of people historically retire in January…last January the rolls added 171k people… nearly 3X as in December. It will be interesting to see if this trend continues, or if our “booming” economy and stock market convinces some of those people to put off retirement.