Monthly Archives

November 2013

US Daily Cash Deficit 11/4/2013

By | Daily Deficit

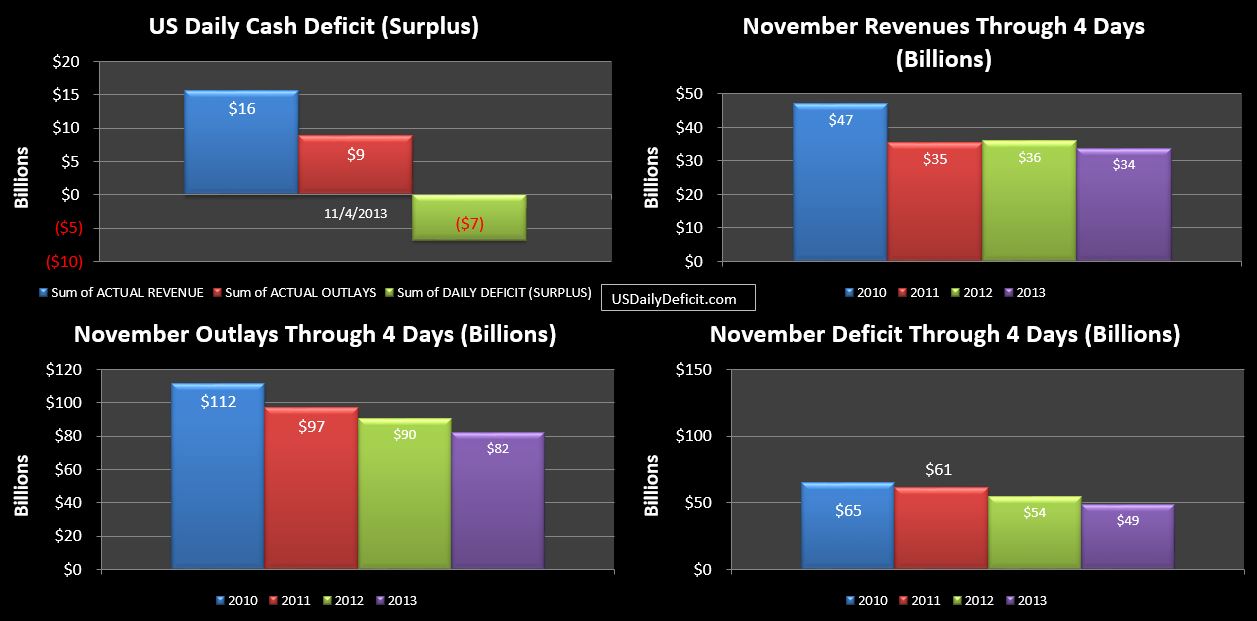
The US Daily Cash Surplus for Monday 11/4/2013 was $6.8B, following up 11/1’s $55.6B deficit that I did not get a chance to post.

11-04-2013 USDD

It’s really too early to make too much of the charts, but 4 days in, nothing is really standing out. Note that as I typically do…I have synchronized 2013 and 2012 to give us more relevant YOY comparisons. November 2012 has an extra business day….it started on a Thursday, while 2013 started on a Friday. This makes the sync fairly easy…I’ll just give 2012 the extra day from the beginning, and other than the holiday, everything else should fall into place. So today’s chart is comparing 3 business days of 2012 ending on Monday 11/5 to 2 business days of 2013…ending Monday 11/4. Revenues and outlays are primarily driven by day of week patterns, so while not perfect…it’s as good as it’s gonna get, and by the end of the month, that extra day will be more or less immaterial.


CBO VS CBO Update 11/5/2013

By | Commentary

Well…though it was delayed by a few weeks thanks to the shutdown, Treasury has released the September deficit numbers….capping off fiscal 2013 with a reported 75B (September)surplus. This brings the full year reported deficit to $680B…$38B higher than the $642B they forecasted back in May.

I reported the Cash Deficit for the FY earlier this month, coming in at $774B…$94B higher. So…WTH!!! When I began this CBO vs CBO piece…I unfortunately started with a bad assumption….that the Cash Deficit I was calculating would more or less tie to whatever the annual reported deficit was. I based this on two data points, FY 2011 and FY 2012. FY 2011 had a $7B difference out of a $1.304T deficit and FY 2012 had a $3B difference out of $1.092T. I figured that was close enough for government work.

Unfortunately…it turns out that these two data points for 9/2012 and 9/2013 are actually an anomaly. Historically, there appears to be a $50-$100B difference on average, though it peaked out in 9/2009 at a $402B difference. Since that was bailout mania year, I have to suspect that somehow they are/were excluding some bailout related things, but not others. Who the hell knows how/what they decided, but I think this just goes to further discredit whatever numbers they decide to publish. They are junk…to be discarded completely.

Now…this kind of defeats the purpose of the CBO vs CBO competition….if they can just make up numbers, it’s kind of a silly game right??

Well….Even if we can’t directly compare the Citizens Budget Office vs the Congressional Budget Office…we can at least look at the forecasts of each and compare it to actuals.

So first up….the Congressional Budget Office. At the time I published the initial CBO vs CBO write up, they were forecasting an 845B deficit, subsequently lowered in May to $642B. Actuals came in at $680B…so not that shabby. The initial forecast was high by $165B…and the later forecast ended up being $38B low.

Now…for the Citizens Budget Office…that would be me. My initial forecast was a 1.006T cash deficit revised down to $800B in May. Actuals ended up at $774B, so my initial forecast was $232B high and my second attempt was $26B high. Now…a  $26B miss from 5 months out….not too shabby if you ask me.

The initial miss, however, can be broken down into a few categories. Of the $232B miss, 85B was due to sequestration…I assumed incorrectly that it wouldn’t happen. Second, I did not forecast the $60B Fannie Mae Payday Loan. The rest was primarily and underestimate of revenues. I did expect higher revenues due to the tax hike (primarily on workers) but month after month they came in higher than expected in my initial forecast. That’s a good thing…unless you pay taxes I suppose.

So in conclusion, I will grudgingly give round 1 to the pros at the Congressional Budget Office. I’m not sure if they just got lucky, or if they really are better than me. But all is not lost. In the initial forecast, I framed this not as a single year competition, but as a 10 year long challenge. So…I’m working up my year two projections and should have them out in a few weeks. Round 2 coming up….may the best organization win.
October 2013 Cash Deficit

By | Commentary, Daily Deficit

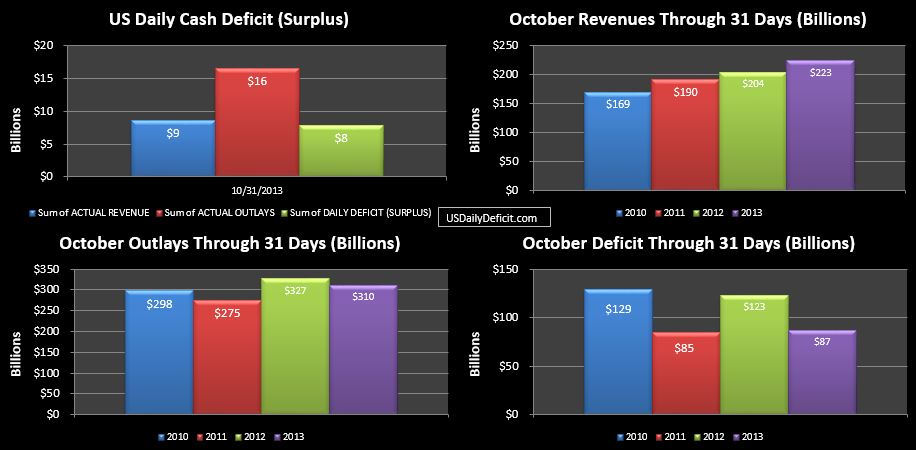
The US Daily Cash Deficit for 10/31/2013 was $7.9B bringing the October 2013 cash deficit to $87B for the month. There is no doubt that this is a material improvement over last year’s $123B deficit, but as discussed in the October preview where I forecasted $91B, it was not exactly  unexpected.

10-31-2013 USDD

Revenues ended up at $223B just shy of my $225B forecast despite about $4B of help from what I assume to be delayed tax refunds. It was still a good number though, representing a 9.5% YOY increase which is pretty close to what we’ve come to expect in 2013.

Outlays ended up at $310B, a $17B decrease over 2012, though about $5B of that was due to timing. The rest…I still have to believe much of it is simply delays in payment and expenditures caused by the 16 day government shutdown. We saw some catch up in the last week, but absent timing issues, we normally expect to see pretty flat outlays…with increases in entitlements being more or less offset by sequestration cuts elsewhere in the budget. I could be wrong….If November is down big as well, that hypothesis may need to be discarded.

As a whole…October was a good month in what has without a doubt been a good year. Revenues up, outlays down….that’s a pretty simple formula for success and honestly I expect more of the same for the remaining two months of 2013. But 2014 will bring us into new territory. Creating a one year blip is not exactly rocket science. Raise taxes…hold spending flat…which is exactly what has happened. Through 10 months 2013 revenues are up a thoroughly impressive 14% and outlays are down 1%.

But come 2014…there are no new tax increases on the horizon…, and Obamacare is poised to wreck havoc on both sides of the ledger…depending on how they decide to account for it. For example…the Obamacare subsidies are technically tax rebates…which I generally treat as “negative revenue”. However…they will be paid directly to insurance companies….so I really have no idea how they will be reported on the DTS…if at all. Penalties, which would show up as new revenues are minimal, and from what I can tell wouldn’t be paid until April 2015 anyway…. then there is the expansion of Medicaid…which I would expect to show up in January 2014…adding billions per month of outlays to that program. All in…it’s a lot of moving pieces which makes it extremely difficult to forecast what will happen…..guess we’ll know in a few months.

What I suspect is that after topping out in 2009 at $1.6T…4 straight years of material improvement end in 2013 at about a ~$700B annual deficit(which is still absolutely terrible by the way). From there…it will stabilize for a year or two before shooting to the moon by the end of the decade.