In what is admittedly a symbolic gesture….I’m on strike through 10/14.
For details….head on over to the Market Ticker
In what is admittedly a symbolic gesture….I’m on strike through 10/14.
For details….head on over to the Market Ticker
The US Daily Cash Deficit for Wednesday 10/9/2013 was $8.5B bringing the October Deficit through 9 days to $56B.
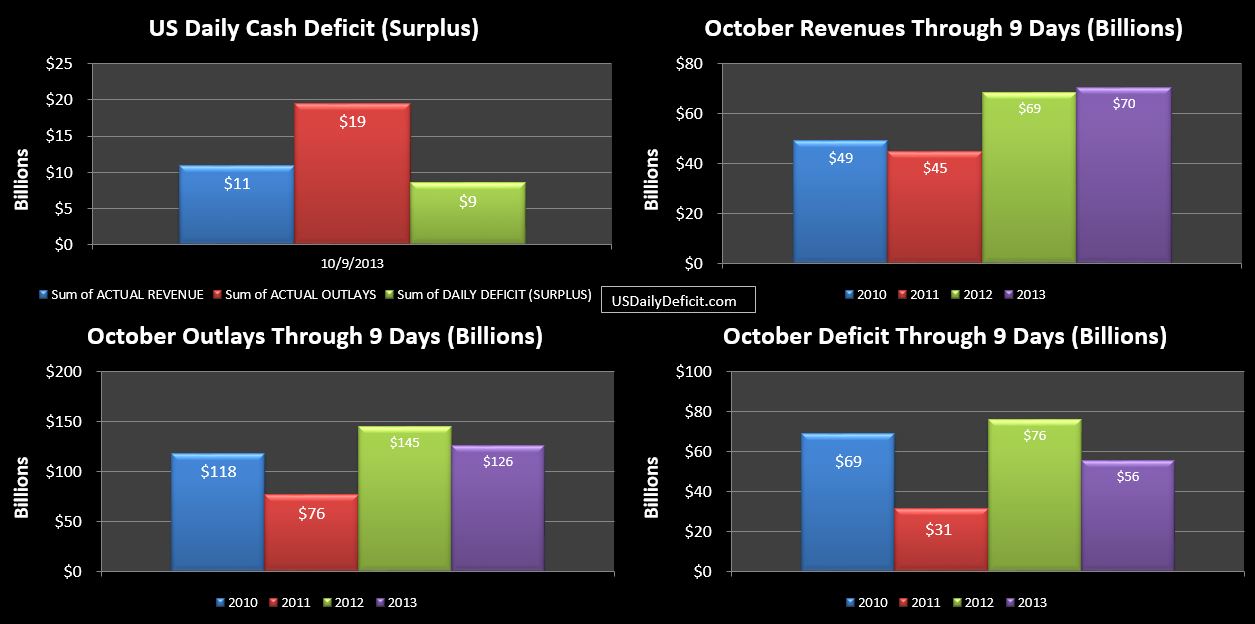
Revenues look to have caught up with last year….it will be interesting if they hold onto that lead through Columbus Day, but we won’t know until next Wednesday. Outlays continue to look suspiciously slow, including one category….tax refunds which slowed to a trickle this month before apparently stopping altogether today… Now, it isn’t unusual for tax refunds to be low….they averaged about $800M a day last October….but zero….this more or less indicates that the IRS is not processing refunds, which jives with an article I read earlier in the week.
I don’t know if this is a one off….maybe they are processing refunds only on certain days….or if there will be no more refunds until the government is re-opened. For the full month, last October had $18B of refunds. So far this month, we are at $2.8B. I account for refunds as reductions to revenue and outlays(this eliminates double counting)…so if they just stop sending them out….it will give October revenues a nice bump….until they catch up on refunds….when it will get flushed back out. If it ends up crossing periods…it screws up the trends:(
Cash was down to $23B with five business days to go before 10/17 “deadline”. I’d expect moderate deficit 10/10, followed by a moderate surplus 10/11. 11/14 is a holiday, but 11/15 should post a pretty solid surplus on corporate tax payments coupled with the long weekend worth of deposits sitting in the mailbox. Then Wednesday 11/16 will look a lot like today with round 3 of Social Security payments, and another small deficit on 11/17. Lew hasn’t amended his $30B estimate, but that looks reasonable enough to me.
It may not even be an issue….rumor has it a short term debt deal is in the works…I’m curious how that would play out. Will they keep all of the “extraordinary measures” games off the books, and just increase it by $150B or so….or would it be enough to bring all the EM back…say $250B, plus another $150B to get through the next six weeks…..and starting the EM games back up again? I suppose it really doesn’t matter anymore. Right now, outstanding debt as of 10/9/2013 stands at $16.7T. There is a very high probability that on 10/9/2014…debt outstanding is going to be knocking on $17.7T…..any takers on that?
The US Daily Cash Deficit for 10/8/2013 was $2.5B pushing the October deficit up to $47B and the cash balance down to $32B…pretty close to where Lew has stated he expects it to land next Thursday.
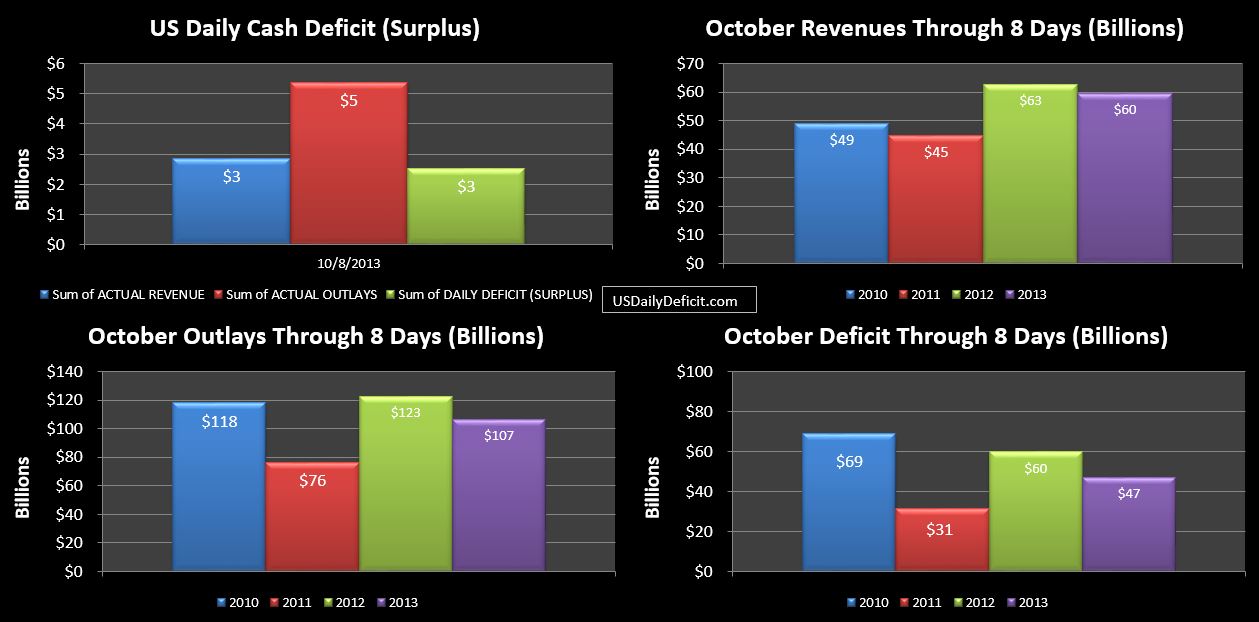
Revenues continue to gain ground on 2012 despite the slow start. Outlays continue to be very light. I can only assume that bills are being slow paid and some things just aren’t getting paid at all. Since this is the cash deficit…no accruals here…. this will create the illusion of a lower deficit now….and a higher deficit later…when all of the bills are caught up and people get their back pay….after the debt limit is raised and the government is re-opened.
Tomorrow should post a bit larger deficit driven by a $12B Social Security payment, partially offset by higher revenues….$5-10B seems most likely, followed by a moderate Thursday deficit, and probably a small surplus on Friday.
I do want to point out that 10/17 is being talked about like it is doomsday in the press. However, from what I have read, Lew isn’t saying that it’s Doomsday…just that he will be out of extraordinary measures, and left with $30B of cash. It looks to me like a $30B cash cushion ought to be just about enough to get to 11/1 before an actual cash flow problem hits….but it’ll be a big one. It’s hard to estimate with precision, but using Friday 3/1/2013 as a go by (the last month to start on a Friday) there were $75B of outlays and $21B of revenues good for a $54B cash deficit. So without a deal….$54B of something doesn’t get paid 11/1….which is exactly why I suspect there will be a deal, but you never know….I didn’t expect the government to actually shut down, yet here we are, 9 days into it, with very little apparent progress being made. Stay tuned…the show is about to begin.
The US Daily Cash Surplus for 10/7/2013 was $5.7B on strong Monday revenues and continued low outlays. Through one week, October 2013 Deficit sits at $45B.
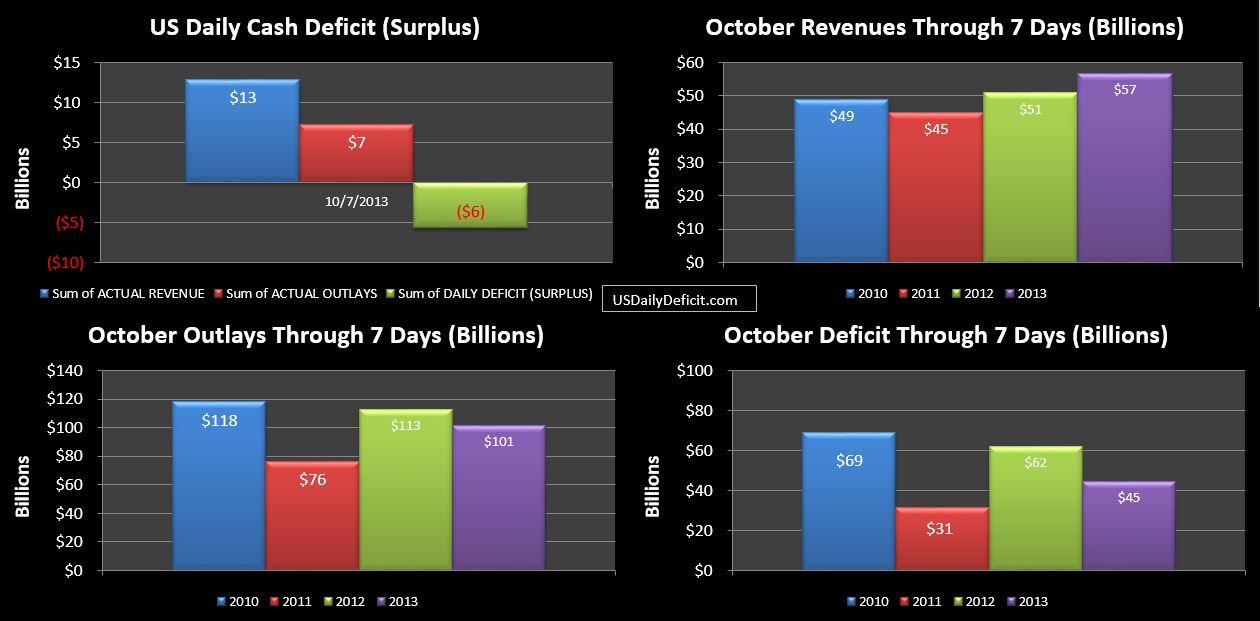
Yesterday I synced up the reports on days of week, however, last year, Monday 10/8 was Columbus day…so no inflows or outflows. This year, Columbus Day is next Monday 10/14. The result in our chart is an apparent improvement in revenues that will likely disappear tomorrow as 2013 shows typically weak Tuesday revenues, and 2012 has strong Tuesday revenues as they cash all of Monday and Tuesdays checks. This won’t fully shake out until next Tuesday after Columbus Day.
Cash edged up again with the surplus and is now at $35B. but will probably be drawn down over the next 3 days.
FY 2013 is now in the bank….racking up a $774B cash deficit, which is still absolutely terrible, but it does mark the fourth year in a row of improvement, and the first sub $1T deficit since 2008. This marks a $318B improvement over FY 2012 which came in at $1092B.
Revenues:
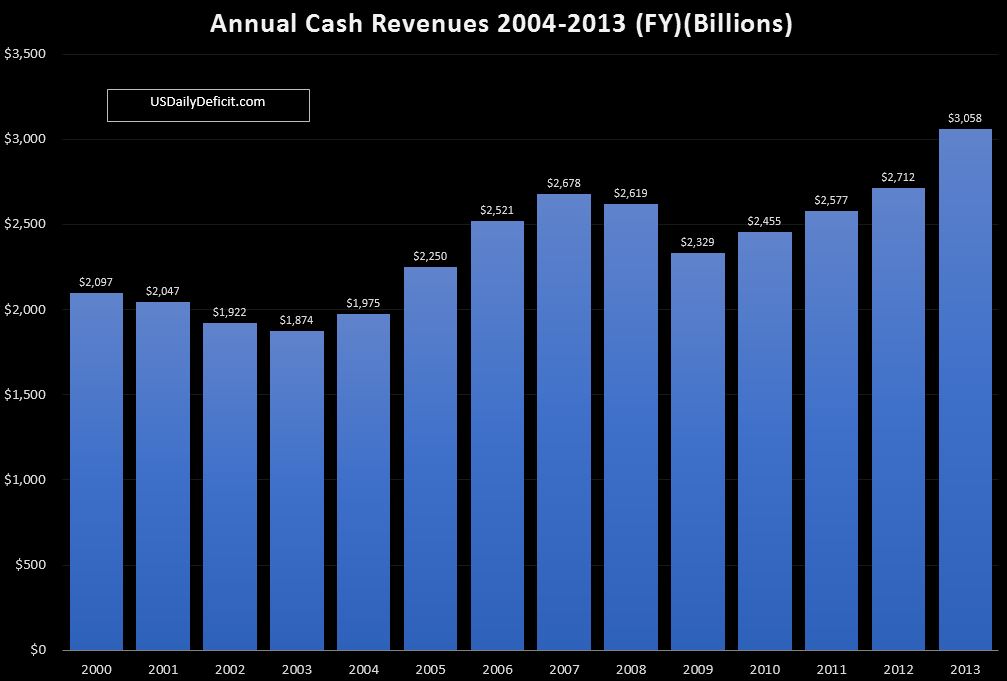
Revenues are pretty much the whole story of FY2013. Driven by tax increases that went into effect in January 1, 2013 and the tax avoidance behavior that preceded it, revenues were up an impressive $346B (13%) for the full FY. Corporate taxes were up $30B (11%), taxes withheld from paychecks were up $201B (11%) and taxes not withheld were up $83B(24%). These results are about $160B higher than I was predicting back in February, so there is no denying it…raising taxes raises revenues…at least in Y1. Of course…$60B of that miss was due to the Fannie Mae payday loan, but a miss is a miss.
Below is a further breakdown of revenues by source(note**they don’t add up because tax refunds offset revenue, but are not included in the table; Deltas compare 2013 to 2012):
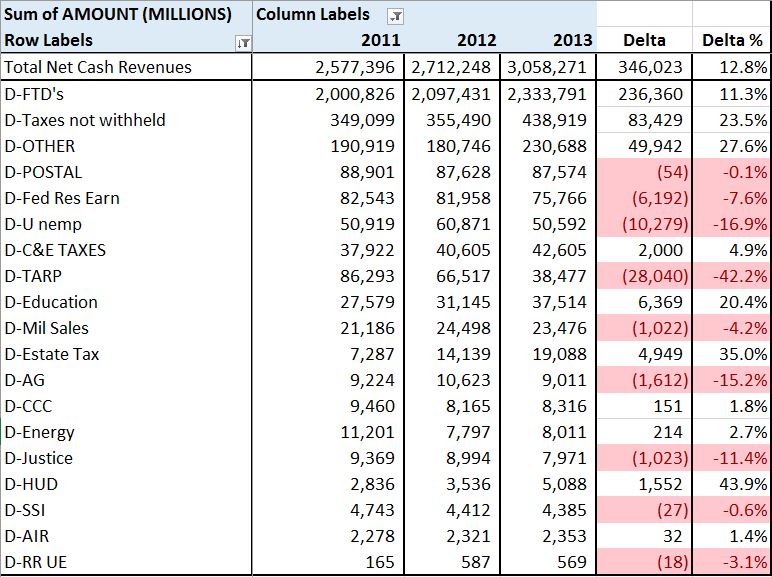
All of our major categories have healthy gains, though “Other” includes the $60B from Fannie Mae. Deposits from the states related to unemployment insurance were down 17%…I would guess that the rates were lowered. Deposits from TARP reimbursements were also down big….a trend that will continue as they have pretty much slowed to a trickle in recent months.
I think even a pessimist such as myself has to be impressed by the YOY revenue gains we have seen in 2013, and will likely continue to see through December. The big question in my mind though is what will happen in calendar year 2014. Imagine a steady state country with $1T of annual revenues in Y1. Then, say they decide to raise taxes across the board 10%. It should not be a shock to anyone if at the end of Y2, revenues have grown 10% to $1.1T. But what to expect for Y3? All else equal, we will likely come in right about $1.1T again. Taxes were only raised once, lifting revenues up to a new steady state. Without a second round of new taxes, we have no rational reason to expect another 10% revenue growth right??
And yet…that is more or less what the CBO is projecting for the next 2 years….continued high growth of revenues. I’ve yet to make a FY 2014 forecast, but I’m thinking right now that 5-6% growth for 2014-2015 would be pretty optimistic. If they stick with 10%….we are going to end up pretty far apart. This is the big unknown at this point. If come April 2014, revenues are only marginally up….it is going to be abundantly clear to all that there is no chance of ever “growing out” of this problem. If, on the other hand…2014 does see 10%+ gains for the second year in a row….even I would have to see at least a glimmer of hope 🙂
Stay Tuned for Part 2…Outlays