Monthly Archives

October 2013

Debt Limit Raised…Now What?

By | Commentary

As most expected, it appears the debt limit was raised and the government has reopened…at least for now. I’m not sure how they got to these dates, but apparently the government will reopen and be funded through for 3 more months expiring 1/15/2014. The debt limit will be raised, being frozen at wherever it ends up on 2/07/2014. I’ll have a better guess at that after they true up the missing “extraordinary measures” ,  but I’m thinking it will pencil out to somewhere between a $400B-$500B increase ending up between $17.1T and $17.2T.

At that point, they will once again be able to employ EM…effectively adding $200-$300B to the debt limit. Now, I’m not sure why they chose 2/7, but if you are trying to maximize the time you get out of EM….this is about the worst date you could ever choose. The reason is that tax refunds pick up in early February and stay strong through March/April before petering out in May. So while last time we were able to hit the debt limit in mid May and squeeze an additional 5 months out of EM….this time, it might be a challenge to make it into early March. Of course, this assumes they don’t take the approach I would if I were Obama…which would be to issue about $3T of debt on 2/6, banking the cash, and making it all the way to 2016 without ever having to talk about this subject again. (not saying that’s what’s right for the country).

So…here we are, the day after a supposedly epic battle. Gotta say, not much has changed. Ok…maybe nothing has changed. I’m still not entirely sure what it was all about. At first it was about delaying Obamacare…which was never going to happen, and then, it was supposedly about balancing the budget…but the thing is, neither party really wants a balanced budget. Balancing the budget means cutting $800B of spending, which means cutting social security right here right now….which is politically impossible for either party. So either this was all about something they were never going to get, or it was about something nobody really wants….

Honestly, the end of this story has been pretty clear for a few years now. The US will default on it’s $17T (and growing) debt sooner or later, it’s just a matter of time. Furthermore, the US will default on the $100T+ of political promises…including SS, Medicare, Medicaid, Obamacare, Food Stamps ect… The math on this is extremely simple folks…it’s just a matter of time before the game is over. It is more apparent than ever that the political will to do the right thing simply does not exist within our democracy.
US Daily Cash Deficit 10/15/2013

By | Daily Deficit

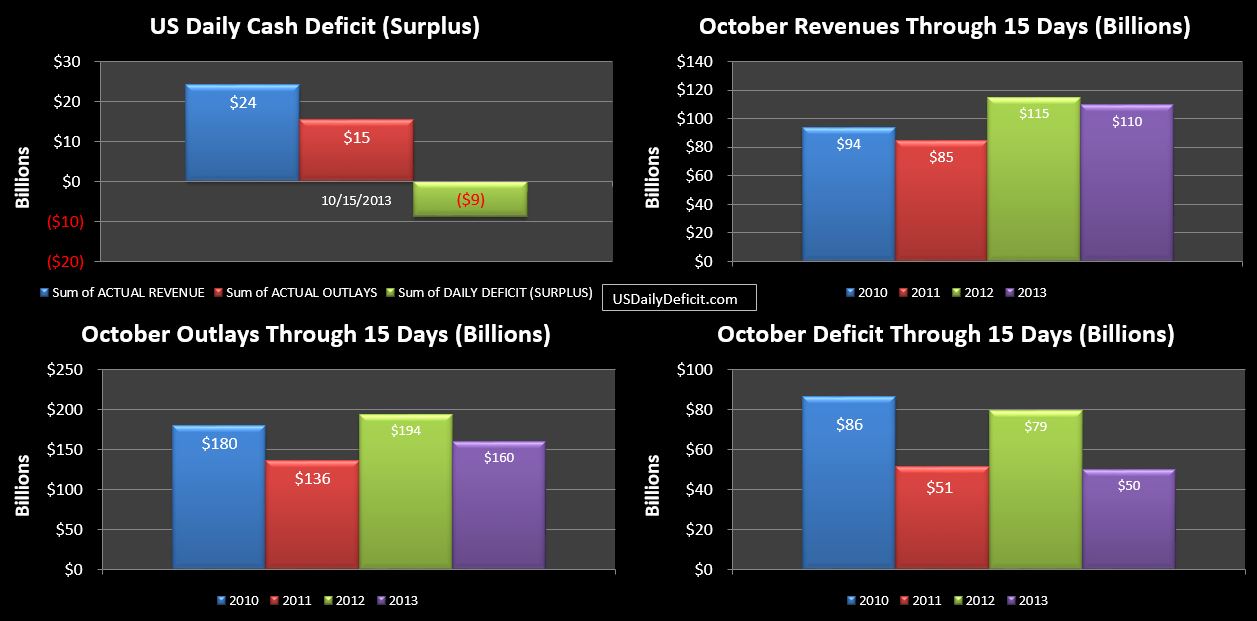
The US Daily Cash Surplus for 10/15/2013 was $8.8B pulling the October 2013 cash deficit through 15 days down to $50B. Contributing to the surplus, $7.4B of corporate taxes were received, a 6% improvement over last year’s 10/15 haul of $6.9B.

10-15-2013 USDD

With the Columbus Day timing behind us, we are more or less back in sync, with 2013 back to trailing 2012 on revenue by about $5B. Offsetting this…Outlays are down by $34B as the shutdown has apparently slowed a lot of payments down and completely shut off others. Add it all up, and at first glance, we are showing some a fairly impressive spurt of deficit reduction….a $29B improvement over October 2012 through the same period.

However…with a shutdown/debt limit deal rumored as of Wednesday afternoon, it is looking like the government will be back to work in a few days and the debt limit will be raised. It may take more than a few weeks to catch up on all of the delayed payments and tax refunds, but when they do, all of these apparent reductions in outlays should more or less wash out.

Cash in hand is $39B with a $5-10B deficit on deck for 10/16 as $12B of round 3 SS payments will go out. If the rumored deal goes through, this will all be a moot point, but it does look like Treasuries $30B estimate for 10/17 will be right on the mark. What I am most interested in seeing is how much the debt increases on day one as Treasury brings all of those hidden “Extraordinary Measures” debts back onto the balance sheet. Last time we had this debate, $238B of debt showed back up on 8/2/2011. That sounds about right to me, so I’ll go ahead and guess $250B and keep my fingers crossed….it will probably be next week before we find out though.

Fiscal 2013 US Cash Deficit: Part 2 Outlays

By | Commentary

In Part 2, we will take a look at Outlays…if you missed part 1 on revenues, you can find it here.

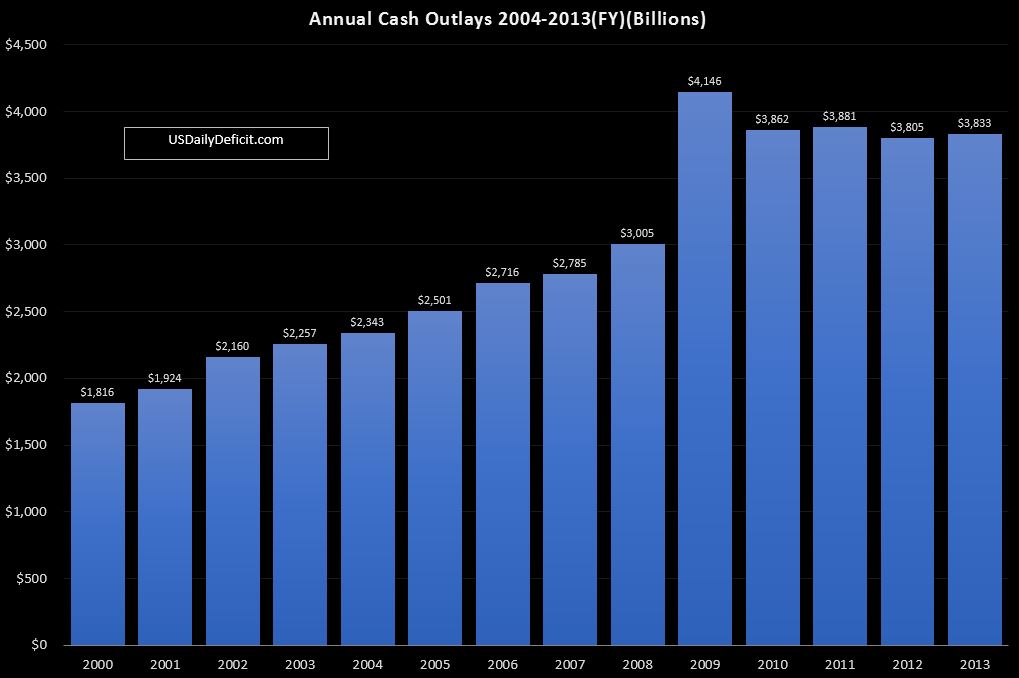
For the fiscal year, net cash outlays ended up at $3.833T, up $28B, or 0.7% from 2012’s 3.805T…so basically flat. So all of those terrible cuts the media has been reporting on all year long since the fiscal cliff and sequestration deal last year….not even enough to cut spending.

10-16-2013 Outlays Chart

The chart above shows cash outlays by year all the way back to 2000(where my data set starts)…you can see that after a spike in 2009 related to stimulus spending, we have been more or less flat for four years now.

While the chart may not be terribly exciting, the internals show a bit more movement. What we essentially have is growth in entitlements continuing unabated, but being offset by cuts elsewhere. Most of the cuts appear to have come from defense vendors, education, unemployment, and “other”. All of that is probably a good thing, but I’m not sure how much longer it can go on. Cutting the first 10% is usually pretty easy…but by the 5th year or so….finding additional cuts gets a lot tougher. Because of this….In the next year or so, perhaps tipped by Obamacare costs, we will probably start seeing outlays resume their upward slope, putting huge pressure on the deficit…especially if revenue growth pulls back from the 10%+ we’ve seen in 2013 to 5% or so….

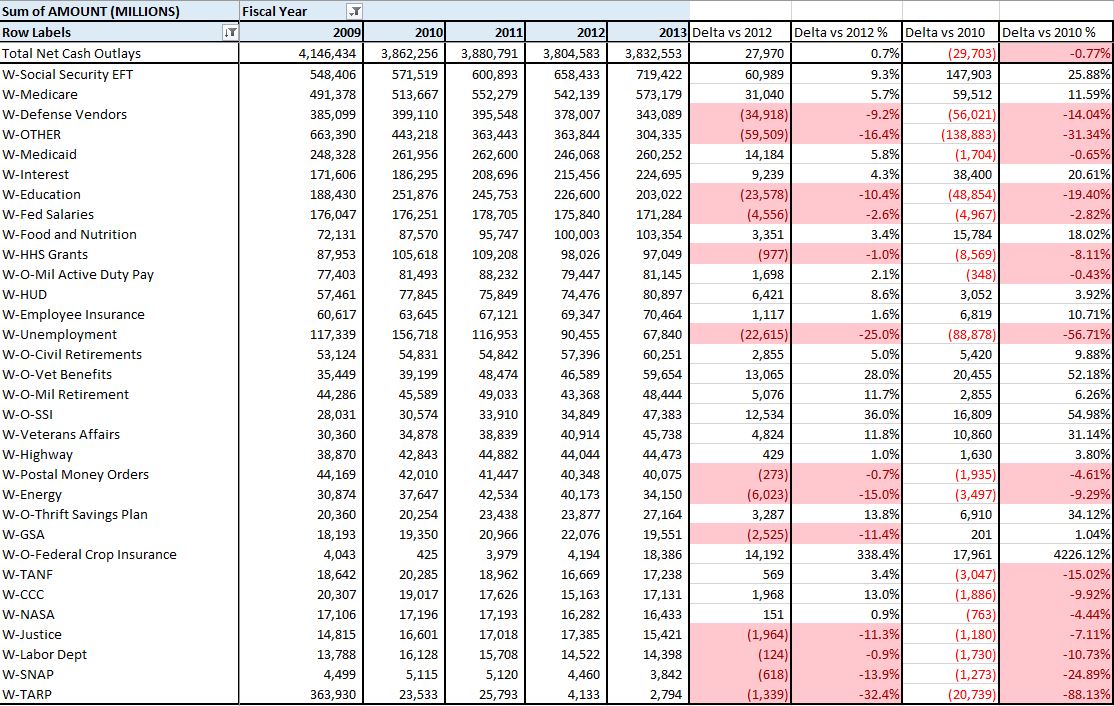
The table below gives a bit more detail on outlays by category comparing first 2013 to 2012, then 2013 to 2010…the start of this 4 year plateau.

10-16-2013 Outlays Table

At the top we have social security, which grew a scary 9.3%, or $61B. I suspect some of that growth is due to a push that accelerated the trend to electronic checks over paper checks as a cost saving measure. Paper checks ultimately get rolled up into “other” (their report…not mine), but only represent a small and shrinking % of the total. Going forward, we will probably see something closer to 5% as enrollment continues to grow at 1M+ per year.

Marching down the list, we see Medicare and Medicaid growing at 5.7-5.8%. Also interesting, Vet Benefits increased 28%, Military retirement outlays increased 11.7% and Veterans Affairs grew at 11.8%. These are all relatively small, but seeing growth rates that high in nondiscretionary categories is not a good sign for the long run.

To wrap it up….it was good news that once again outlays were more or less flat for the fourth year in a row, thanks in part to the sequestration that many, including myself, thought was unlikely to actually stand. So in that…a small victory. But the question remains…what’s next? Given the uncertainty surrounding the shutdown and the debt limit, it’s kind of hard to predict, but if we can assume that these are resolved and more or less maintain the status quo, I guess we end up next FY closer to $3.9T….perhaps higher if Obamacare costs push through to the bottom line.

In the long run….all that is going to matter is the growth of entitlements. If we can’t cut the growth of SS, Medicare, Medicaid, food stamps ect….we’re toast. Unfortunately, everyone is too scared to talk about that lest they piss off the huge senior voting block. And that’s why it won’t ever happen. Apparently, in a democracy, collapse is the only way to stop the old/rich/powerful from screwing over the young/poor/weak.


US Daily Cash Deficit 10/11/2013

By | Daily Deficit

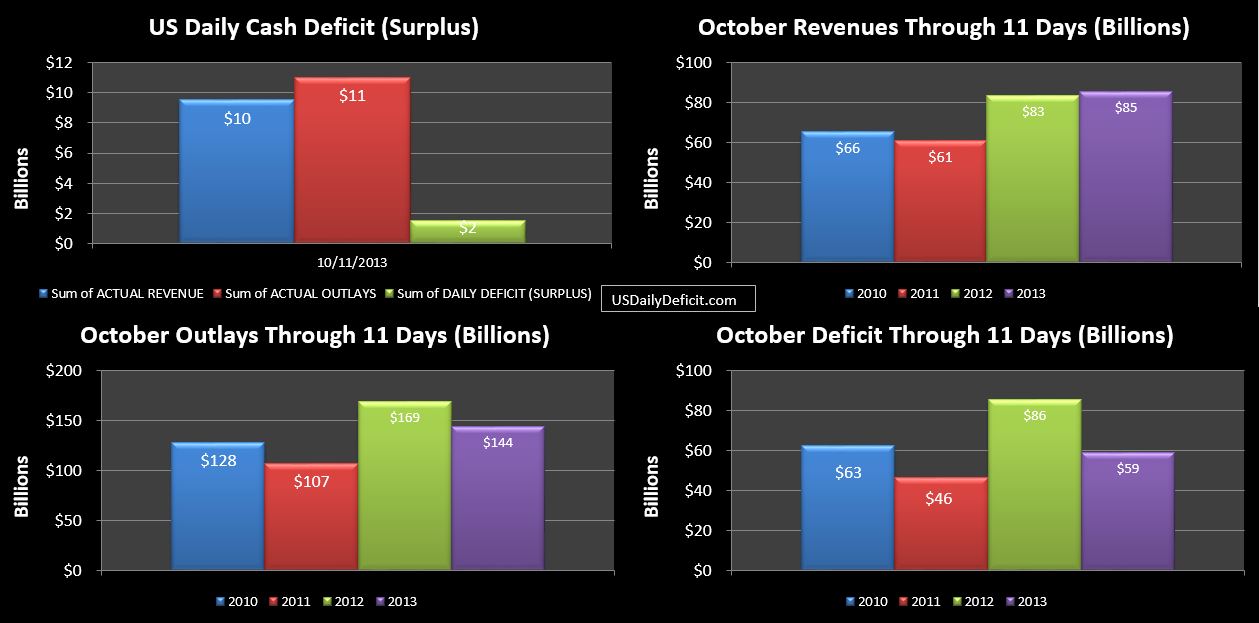
The US Daily Cash Deficit for Friday 10/11/2013 was $1.5B pushing the October 2013 deficit through 11 days to $59B. For the third day in a row, no tax refunds went out. We aren’t talking big $, but I’d guess at least $2-3B of refunds are now pending, growing by~$0.5B per day.

10-11-2013 USDD

No real changes to see here…revenues slowly creeping up and costs continuing to look suspiciously low. Tomorrow’s report should get us more or less back into sync with last year with Columbus day behind us and a nice slug of corporate taxes on deck.

Cash in hand fell to $35B with just a few more days to go until the 10/17 non-event date, so that $30B estimate still looks reasonable to me, and like just about enough to squeak by until the end of the month…especially if the government is still shut down. So circle 11/1….that’s the day things start really getting messy.  Cash in hand will be pretty close to zero, and while revenue will be about ~$20B…there are about $70B of payments due, including about $40B of SS and Medicare along with a lot of other government pensions and military active duty pay. Somebody’s check is going to bounce….

If there isn’t a deal by then, I have to think things could get real bad real fast. I still don’t expect that to happen, but you never know….I mean who thought a month ago the government shutdown would happen….much less still be going on mid month?

US Daily Cash Deficit 10/10/2014

By | Daily Deficit

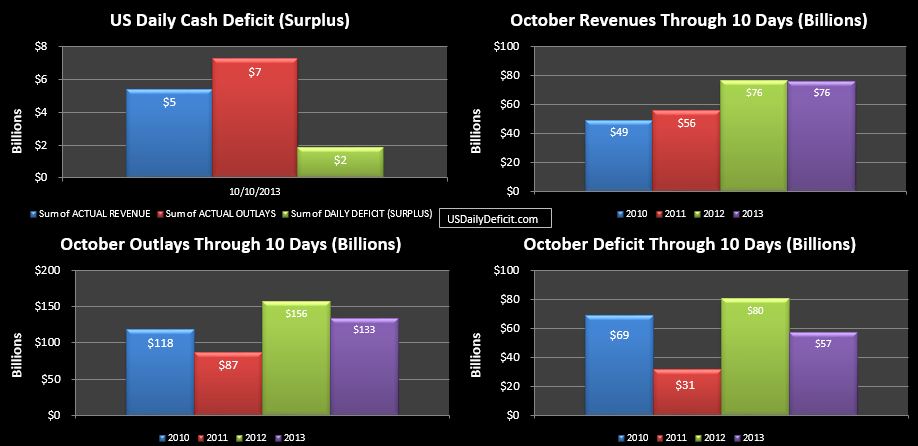
The US Daily Cash Deficit for Thursday 10/10/2013 was $1.9B bringing the October 2013 deficit through 10 days to $57B.

10-10-2013 USDD

Tax refunds are zero again, and outlays continue to be suspiciously low….$23B under the year ago amount, though about $5B of that is timing. My guess is that due to the shutdown…a lot of things just aren’t being paid now…. but will after a shutdown/debt limit deal is reached.

Despite the deficit, cash increased $13B to $36B thanks to some extraordinary measures trickery. As I write this, there does not seem to be an imminent deal on either the debt limit or the shutdown. I wouldn’t stress out yet though….It still looks to me like 11/1 is the date that the cash runs out.